
 Home
Home News
News
- The token is trading below the supply zone on the daily time frame.
- The pair of SHIB/USDT is trading at the price level of $0.00001264 with a decrease of -1.63% in the past 24 hours.
The token has shown strong bullish momentum has gained more than 70% in the past few weeks with bulls driving up the price of the token. It remains to be seen if the bulls can continue the uptrend or not.
SHIB token on the daily chart
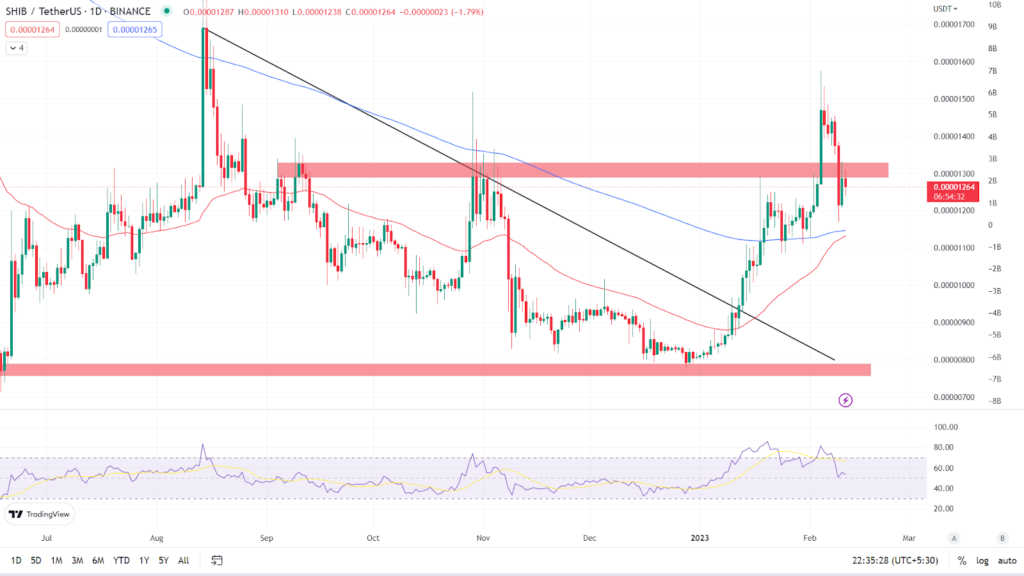
The token has retraced for a pullback on the daily time period after a strong up move. According to the daily chart, the SHIB token was trading at $0.00001264, a loss of -1.63% in the last 24 hours. The token has crossed and sustained above its key Moving Averages of 50 and 200 EMA. (Red line is 50 EMA and the blue line is 200 EMA). To continue the upward trend, the token must break above the supply zone.
Relative Strength Index: The RSI curve of the asset is currently trading at 53.91 just above the halfway mark of the 50 point line. The recent fall in the token has led the value of the RSI curve to decline. The RSI curve has crossed the 14 SMA downward indicating bearishness. If the token is able to bounce back and bulls drive the price of the token higher than we can expect the value of the RSI curve to rise again.
Analyst view & Expectations
The token has fallen below the supply zone on the daily time frame and bulls are trying to take command of the trend. Investors should hold their buys and wait for the token to break above the $0.00001329 resistance level and then buy to get more clarity on the direction of the trend. Whereas, intraday traders also have a good opportunity to go long and book profits as per their risk to reward ratios.
According to our current SHIBA INU price projection, the value of SHIBA INU is expected to climb by 14.03% in the next few days, reaching $ 0.00001452. Our technical indicators indicate that the current sentiment is bearish, with the Fear & Greed Index reading 49. (Neutral). Over the previous 30 days, SHIBA INU had 20/30 (67%) green days and 11.37% price volatility.
Technical Levels
Major support: $0.00001207 & 200 EMA on the daily chart.
Major resistance: $0.00001329 & $0.00001480
Conclusion
The token is taking a retracement after a strong up move and is trading below the supply zone on the daily time frame. Investors should wait for a clear indication before acting.
Disclaimer: The views and opinions stated by the author, or any people named in this article, are for informational ideas only, and they do not establish the financial, investment, or other advice. Investing in or trading crypto assets comes with a risk of financial loss.

With a background in journalism, Ritika Sharma has worked with many reputed media firms focusing on general news such as politics and crime. She joined The Coin Republic as a reporter for crypto, and found a great passion for cryptocurrency, Web3, NFTs and other digital assets. She spends a lot of time researching and delving deeper into these concepts around the clock, and is a strong advocate for women in STEM.


