
 Home
Home News
News

- The coin has shown bullish actions in the previous sessions.
- The pair of TRX/USDT is trading at the price level of $0.06476 with a gain of 1.60% in the past 24 hours.
The Tron (TRX) coin has shown signs of strong bullish momentum in the past few weeks with bulls driving up the price of the token. The trend is in the favor of the bulls and the bears are trying to regain control.

TRON coin on the daily chart
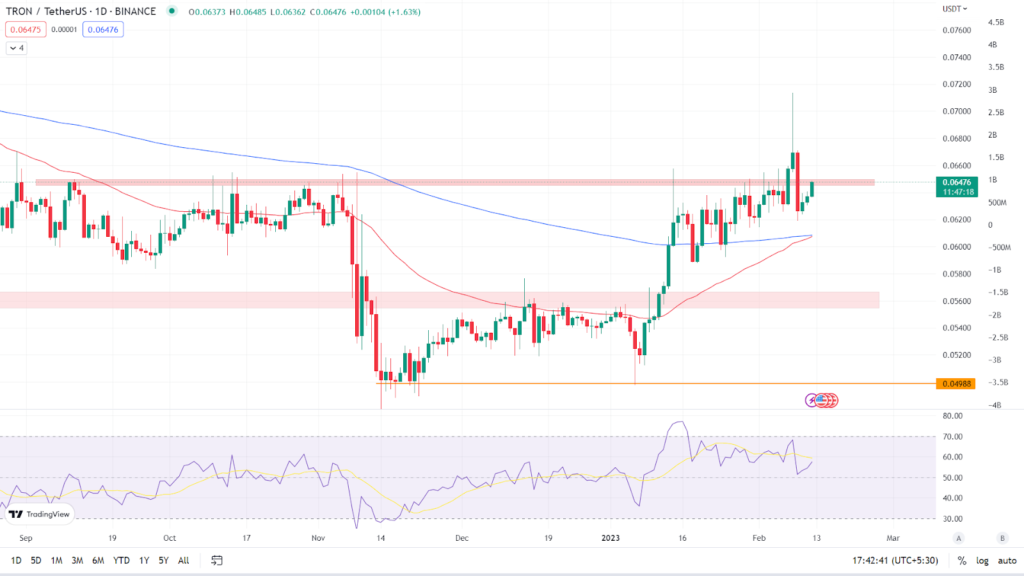
The coin is facing strong resistance at the supply zone on the daily time frame. As we can see on the daily chart, the TRX coin was trading at $0.06476 with a gain of 1.60% in the past 24 hours. The coin has crossed and sustained above its key Moving Averages which are 50 EMA and 200 EMA. (Red line is 50 EMA and the blue line is 200 EMA). It remains to be seen if the coin can break above the supply zone and continue the bullish momentum.

Relative Strength Index: The asset’s RSI curve is currently trading at 57.91, bouncing off the halfway mark of the 50 point line. The recent increase in the coin price has led the RSI curve’s value to rebound. The rejection from the supply zone caused the RSI curve to cross below the 14 SMA. If the coin can break above the supply zone and continue its bullish momentum, the RSI curve’s value will rise even further.
Analyst view & Expectations
The coin recently attempted to break above the supply zone but failed and was strongly rejected by the bears. The coin is trying to break above the supply zone once again. To get further confirmation, investors should wait for the coin to break above the supply zone before buying. Intraday traders, on the other hand, have a good opportunity to go long and book profits based on their risk-reward ratios.
According to our current TRON price prediction, the value of TRON is expected to climb by 7.87% in the next few days, reaching $ 0.069912. Our technical indicators indicate that the current sentiment is bullish, with the Fear & Greed Index reading 50. (Neutral). Over the previous 30 days, TRON had 18/30 (60%) green days and 2.67% price volatility.
Technical Levels
Major support: $0.06250
Major resistance: $0.06500
Conclusion
The coin is heading for a breakout above the supply zone and is forming a bullish chart pattern as per the price action. Investors who want to buy now can do so by keeping a stop loss and managing their risk to reward ratio.
Disclaimer: The views and opinions stated by the author, or any people named in this article, are for informational ideas only, and they do not establish the financial, investment, or other advice. Investing in or trading crypto assets comes with a risk of financial loss.

Andrew is a blockchain developer who developed his interest in cryptocurrencies while pursuing his post-graduation major in blockchain development. He is a keen observer of details and shares his passion for writing, along with coding. His backend knowledge about blockchain helps him give a unique perspective to his writing skills, and a reliable craft at explaining the concepts such as blockchain programming, languages and token minting. He also frequently shares technical details and performance indicators of ICOs and IDOs.


