
 Home
Home News
News
DYDX token in the recent sessions displays a bearish setup with giving up gains from the top. Bulls are encountering strong refusal near the highs at $3.50. From the previous months, bulls strumbled to surpass and sustain above the resistance of $2.80. In this month, bulls successfully exited the range with volume addition. Despite the solidity showcased by the bulls, mighty sellers are also arranged well on the top, which was seen in the last sessions resulting in a retracement.

Daily Chart Shows Price Rejection from the Top
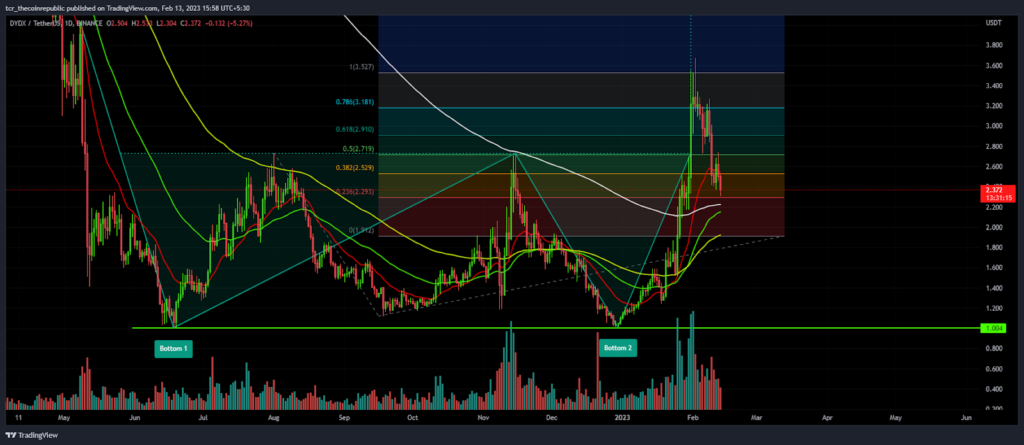
On the daily chart, DYDX token decisively flees the range and registers breakout in the last weeks. The chart structure indicates trend relapse by showing the unwinding actions of buyers. At the same time, Fib levels are admired by the token and going exactly as per the levels seen on the chart. However, double bottom structure forms on the chart which leads bullishness on the chart in the past days.

However, after the breakout of multiple hurdles and delivering the price rally, it is expected to show some profit booking for an additional pullback. The immediate support of the 200-day EMA will be tested in the upcoming trading hours. If price cannot hold the support range of $2.10, then more bearishness on the chart resumes.
Short Term Charts
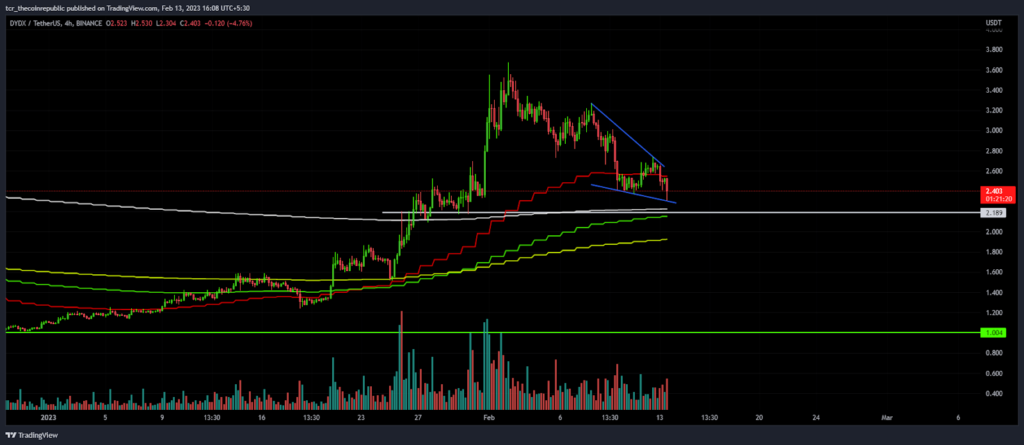
On the 4-hour chart, DYDX token is initiating a falling wedge structure having its upper neckline at $2.40, which, if it cracks, leads to further bounces. Despite the correction, there is strong support of multiple EMA’s projected at $2.00.
At the time of writing, DYDX token is trading at $2.39 with a huge intraday drop of 11.27%. While the trading volume rises by 22%, it shows a battle between buyers and sellers.
For the last six months, the token has been stuck in narrow range($1.00 to $2.00) and is keen to escape the range to break out of the upper range. This month the bulls aggressively busted the range and surprised investors.
What Traditional Indicator Indicates ?
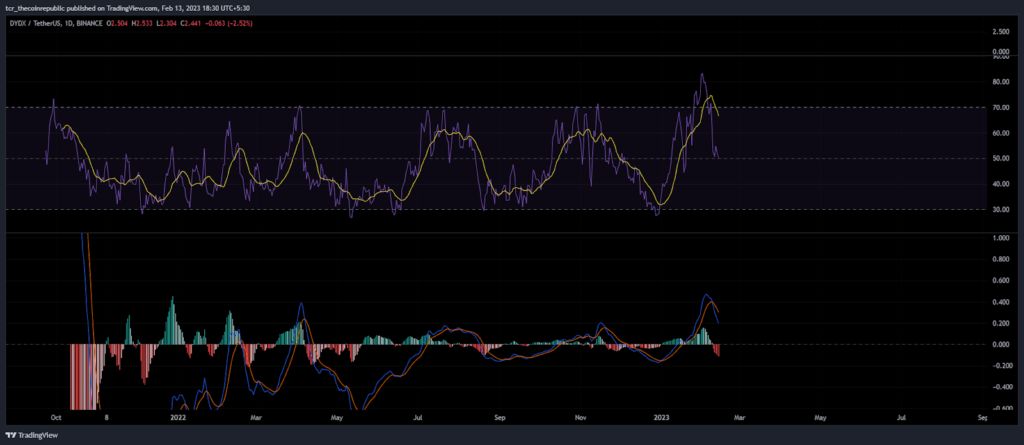
RSI (Neutral): The RSI curve sinks from overbought zone to the neutral range in the last session, placed near 50. Moreover, the aggressive selling witnessed on the chart indicates sellers eagerly shelve to book profits or exit their positions.
MACD: The MACD indicator launches little red bars on the histogram, and the bearish crossover was also witnessed on the chart. The trend has reversed from bullish to mild bearish in the last 24 hrs.
Technical Levels:
Support Levels: $2.00 and $1.40
Resistance Levels: $3.50 and $4.00
Conclusion:
DYDX Token cannot maintain and hold gains near the upper end of Bollinger Band. The token has faced intense selling pressure in the last hours, and bulls are losing momentum.
Disclaimer
The views and opinions stated by the author, or any people named in this article, are for informational ideas only, and they do not establish financial, investment, or other advice. Investing in or trading crypto assets comes with a risk of financial loss.

Nancy J. Allen is a crypto enthusiast, with a major in macroeconomics and minor in business statistics. She believes that cryptocurrencies inspire people to be their own banks, and step aside from traditional monetary exchange systems. She is also intrigued by blockchain technology and its functioning. She frequently researches, and posts content on the top altcoins, their theoretical working principles and technical price predictions.


