
 Home
Home News
News
- THORChain was currently at $1.71 with an increase of 1.21% during the intraday trading session.
- The 24-hour low of RUNE was $1.68 and the 24-hour high of RUNE was $1.72.
- The current price of THORChain is below 50, and 100 days EMA.
The current price of THORChain was around $1.71 with an increase of 1.21% during the intraday trading session. The pair of RUNE/BTC was currently trading at 0.00007824 BTC with an increase of 0.75% over the intraday trading session.
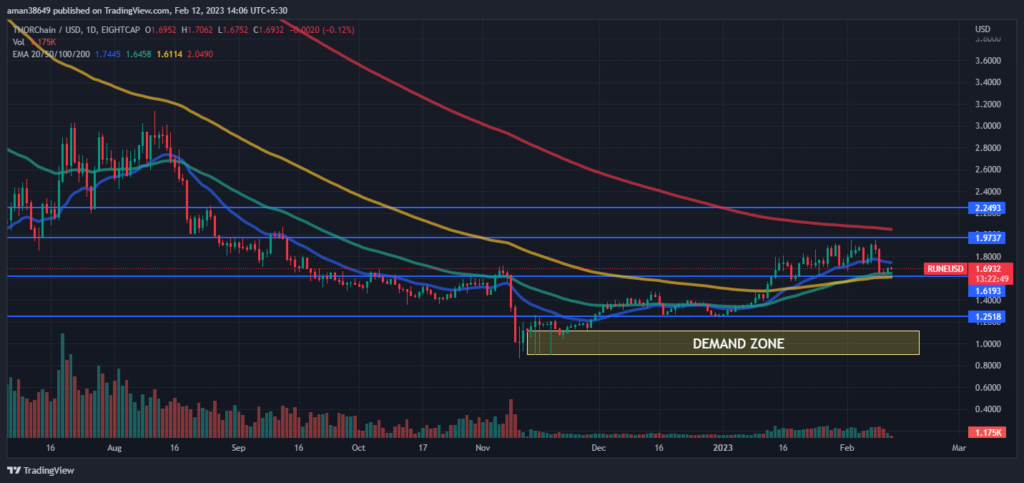
THORChain price prediction suggests that RUNE is currently in a bearish trend. THORChain was constantly rising since the start of 2023 but in a wave pattern which suggests that the market is not fully taken over by the bulls. Sellers are trying to keep the RUNE in check as they are also trying to take the market back which they were controlling since Aug 2022. The appearance of the Evening star candlestick pattern over the daily trading chart suggests that there is a high possibility of a trend reversal. This suggests that sellers are coming in the majority and trying to take back the control of the market from buyers. RUNE is trading above its primary support of $1.619 and if sellers take over the market and pull THORChain down then it may again enter its demand zone or accumulation zone. This can put THORChain in a crucial stage.
The volume of the coin has decreased by 41.84% in the last 24 hours. The decrease in volume indicates that the number of sellers has increased. That means there is no relationship between the trading volume and the price of RUNE, this signals weakness in the current bullish trend and possible trend reversal. The coin’s price is heading above the 50, and 100-Daily Moving averages.
The technical analysis of THORChain
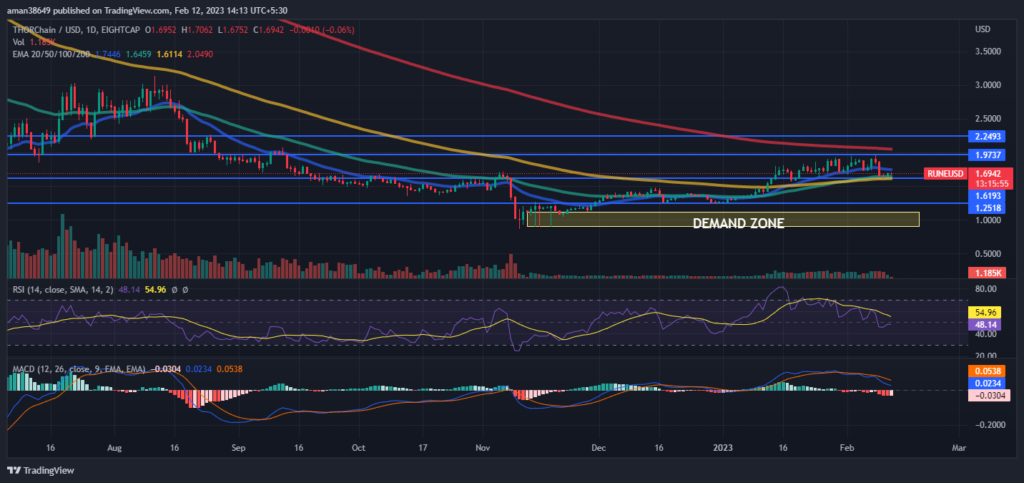
RSI is shown a negative crossover and is declining in the oversold zone which will indicate that sellers are coming in the majority and trying to take over the market. The current value of RSI is 48.26 which is below the average RSI value of 54.97. This indicates that there is a large amount of selling happening which is causing a reversal to a downtrend.
The MACD and MACD signals are intersecting and also giving a negative crossover over the intraday trading session which verifies the RSI indicator and it shows the weakness in the current uptrend and a possible trend reversal.
Conclusion
THORChain has been constantly rising since the start of 2023. But the appearance of evening star candlestick patterns over daily trading has made a trend reversal. This indicates that sellers are coming in the majority and are trying to take the market from buyers. RSI and MACD also verify trend reversal as they make a negative crossover on the daily trading chart and strengthen the current bearish downtrend of RUNE.
Technical Levels-
Resistance level- $1.973 and $2.249
Support level- $1.619 and $1.251
Disclaimer-
The views and opinions stated by the author, or any people named in this article, are for informational purposes only, and they do not establish financial, investment, or other advice. Investing in or trading crypto assets comes with a risk of financial loss.

Nancy J. Allen is a crypto enthusiast, with a major in macroeconomics and minor in business statistics. She believes that cryptocurrencies inspire people to be their own banks, and step aside from traditional monetary exchange systems. She is also intrigued by blockchain technology and its functioning. She frequently researches, and posts content on the top altcoins, their theoretical working principles and technical price predictions.


