- Home retailer BBBY Canadian operations is ‘insolvent’ as per the latest court filings
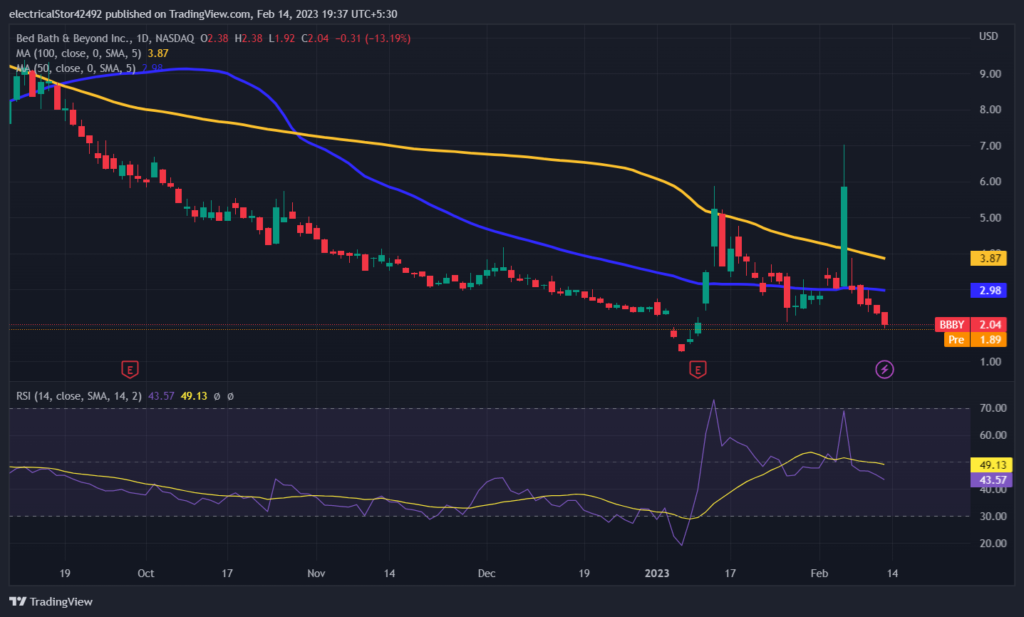
- Technical indicators of BBBY are favoring the downside trend. It is trading near the value of $2.
Bed Bath & Beyond Inc. (BBBY) is a leading omnichannel retailer of home goods and furnishings, with over 900 stores across the globe. The company offers a broad range of products, including bedding, bath towels, kitchen appliances, and decor items. However, in recent years, the company has faced significant challenges as it struggled to keep up with the fast-changing retail landscape.
The struggling home retailer has gone through a series of setbacks as they are struggling to keep their business float.While the company experienced a surge in demand for home goods, the pandemic-related supply chain disruptions and temporary store closures also led to a decline in revenue. In a recent court filings Canada operations of BBBY is insolvent. The financial of the company has been struggling and has increased a negative sentiment among the investors.
BBBY stock has a market cap of $238 Million and has a negative EPS. Investors are becoming concerned for the BBBY company.
Are Bulls Of BBBY Giving Up?

The weekly technical chart of the BBBY suggests a downside trend in price. On the daily chart it is trading near the value of $2 with a drop of 13% in the intraday session. It has formed a bearish engulfing candle. This may continue a downside trend to $1.5 in the near future. Resistance of the BBBY can be seen near $2.5.Meanwhile the support of the asset price can be seen near $1.5.It is currently trading below the 50 and 100 Daily Moving Average. There can be a downside crossover which can push the asset price to a new low in the future.
RSI of the asset price is near 43 suggesting its presence in the neutral zone.There is a downside slope which can push the asset price to a new low.
Conclusion
Bed Bath & Beyond is currently struggling to keep their financials up.Various investors are concerned about the future of BBBY.
Technical Levels
Major Support: $1.75
Major Resistance: $2.5
Disclaimer
The views and opinions stated by the author, or any people named in this article, are for informational purposes only, and they do not establish financial, investment, or other advice. Investing in or trading any stock or crypto assets comes with a risk of financial loss.

Adarsh Singh is a true connoisseur of Defi and Blockchain technologies, who left his job at a “Big 4” multinational finance firm to pursue crypto and NFT trading full-time. He has a strong background in finance, with MBA from a prestigious B-school. He delves deep into these innovative fields, unraveling their intricacies. Uncovering hidden gems, be it coins, tokens or NFTs, is his expertise. NFTs drive deep interest for him, and his creative analysis of NFTs opens up engaging narratives. He strives to bring decentralized digital assets accessible to the masses.


 Home
Home News
News


