
 Home
Home News
News
- XCN token price has been on an uptrend as the token price bounced off the demand zone.
- XCN token price is trading near the supply zone and as of now, it has started consolidating near it.
- The pair of XCN/BTC trading at the price of 0.0000080 with an increase of 269% in the last 24 hours.
XCN token price has been on an uptrend and in the past 24 hours, it has bounced off the demand zone. The token price is still hovering around the supply. Although it has formed a bearish rejection candlestick pattern on a daily time frame. It has formed a rounding bottom pattern on a daily time frame.
XCN token price shows a strong bullish momentum
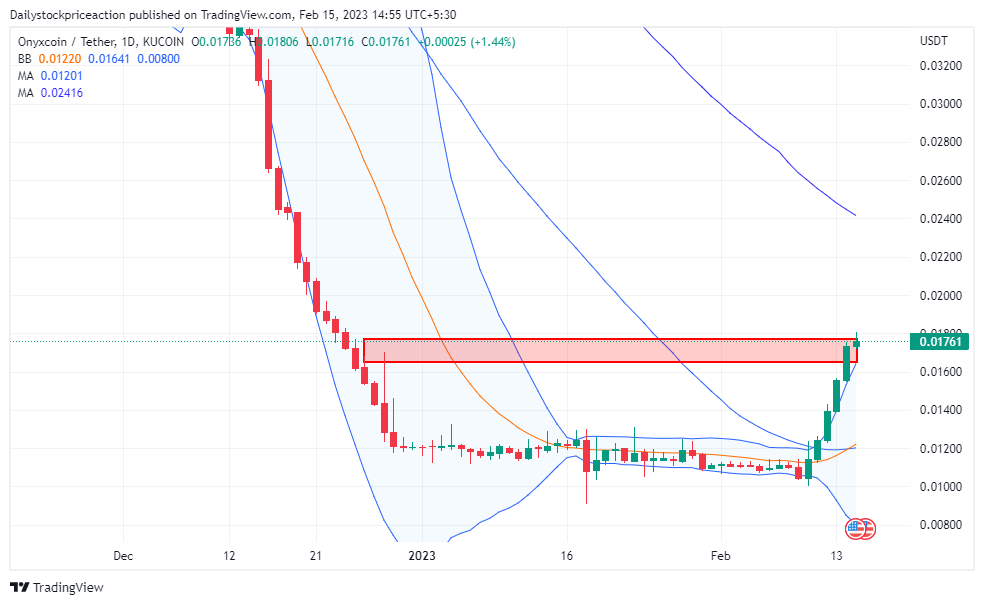
XCN token price is forming higher high and higher low formation on daily time frame. The token price has given the breakout of every single small-term resistance and now it is trading at the supply zone. The XCN token price is trading at the upper band of the Bollinger band indicator after bouncing off the lower band of the indicator. The XCN token price has given a breakout of 14 SMA and 50 MA in the daily time frame.
Currently, it is resting at these Moving averages. Despite the bullishness in the last 24 hours, the token price is yet to break out of the 100 Moving Average. Therefore the token price can face rejection moving upside and then the token price can fall heavily. Volumes have decreased despite the bullish mess in the last 24 hours. Therefore investors should remain cautious and wait for a clear trend.
The XCN token price is forming a rounding bottom pattern on the daily time frame
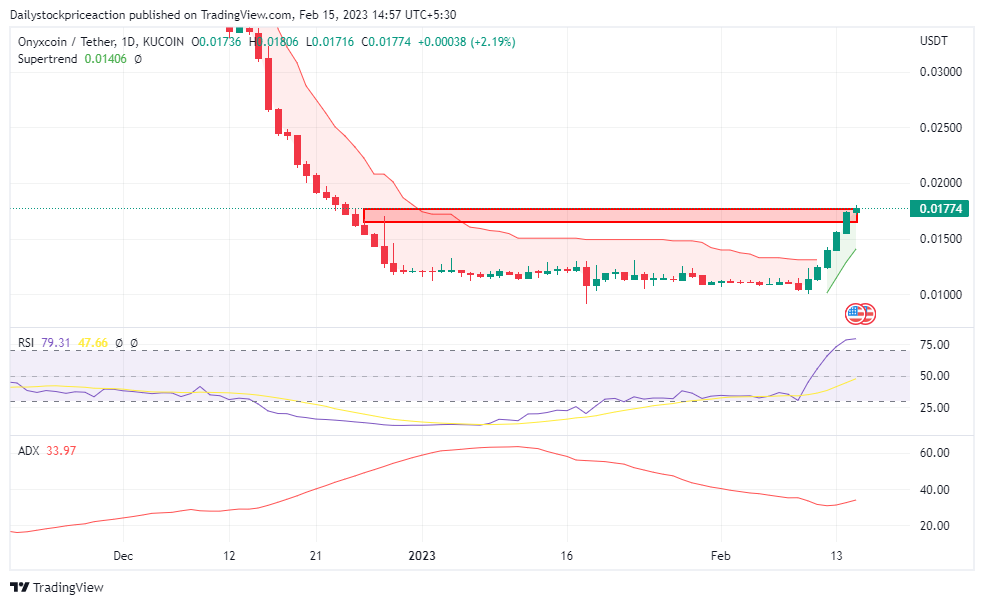
As the token continues to decline, the ADX curve has been dropping for a greater time period. The ADX curve has fallen out of the 20 level and turned higher on a daily time frame. As of a 4-hour time period, the club price is at the short-term demand zone. It is encouraging for the price of tokens. Investors want to hold off until a bullish candle pattern forms in the demand zone.
RSI curve is trading at the level of 79.75. The RSI curve has crossed the halfway mark of 50. Once the token gives a breakout of a rounding bottom pattern on a daily time frame, the RSI curve can be seen moving up. The RSI curve has crossed the 14 EMA yellow line indicating a short-term bullishness. However, the RSI curve has already reached the overbought zone of 70 and therefore investors should remain cautious and not get trapped in such volatility.
Supertrend indicator is positive as the token price broke the important small-term supply zone on the daily timeframe. Since then the token price has failed to give a breakout of the supply zone in a larger time frame. As of now, the token price has broken the super trend sell line which has triggered a buy line.
Conclusion: XCN token price has been hovering around the supply zone. The technical parameters suggest a bullish move in the upcoming days. The price action is also suggesting the same. It remains to see if the token price will break the rounding bottom pattern or fall heavily
Support: $0.013 and $0.015
Resistance: $0.09 and $0.025
Disclaimer
The views and opinions stated by the author, or any people named in this article, are for informational ideas only, and they do not establish financial, investment, or other advice. Investing in or trading crypto assets comes with a risk of financial loss.

With a background in journalism, Ritika Sharma has worked with many reputed media firms focusing on general news such as politics and crime. She joined The Coin Republic as a reporter for crypto, and found a great passion for cryptocurrency, Web3, NFTs and other digital assets. She spends a lot of time researching and delving deeper into these concepts around the clock, and is a strong advocate for women in STEM.


