
 Home
Home News
News

- The price of the SAND token has moved from the demand zone to the supply zone, signalling a strong positive trend.
- On a daily basis, the token price has rushed through the hourly resistance recently with a strong bullish candlestick formation.
- SAND token price forms a cup and handle pattern on a daily time frame.
SAND token price has been on a rise for the past couple of days and recently it has started falling, following the rejection of the supply zone. If the SAND token price jumps off the small-term demand zone then it can be seen rising much higher breaking the supply zone.

SAND token price trends in a bullish trajectory
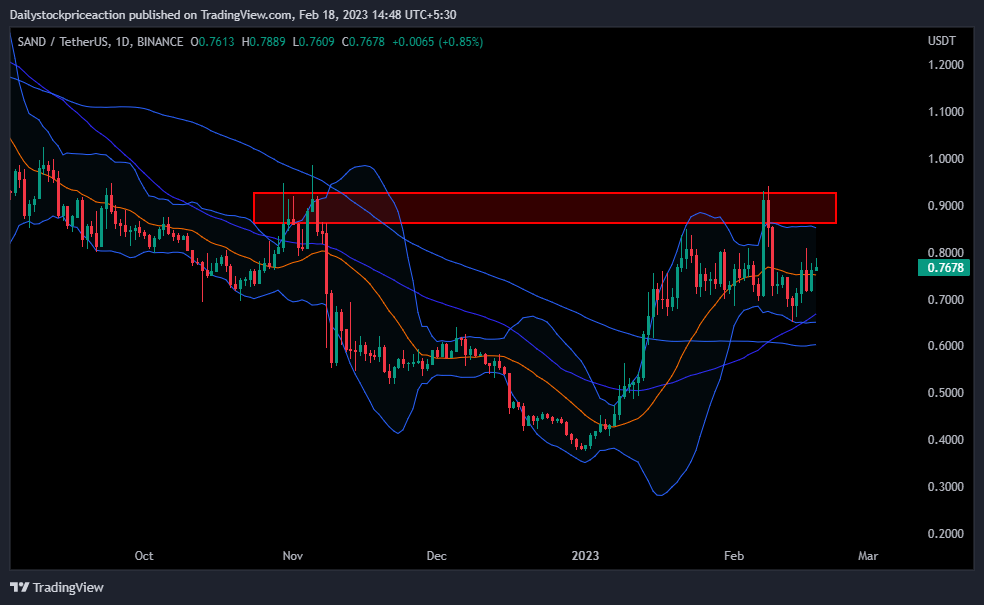
The SAND token is currently trading near the supply zone due to positive momentum in the cryptocurrency market, and its price action indicates a potential bullish trend. Daily, the SAND token is trading above the demand zone and significant moving averages, having broken these MAs during the positive momentum.

As the token price moves upwards, it is forming an upper-high and upper-low price structure after finding support during a downturn. The SAND token’s price has rebounded from the lower band and is now trading at the upper band of the Bollinger band indicator, but it has not yet crossed the upset band.
Due to increased volumes following a sharp rise in the token’s price, investors should exercise caution and wait for a valid breakout before expecting a continued upward move, as this indicates high volatility in the upcoming trading days.
The SAND token price is forming a cup and handle pattern on a daily time frame
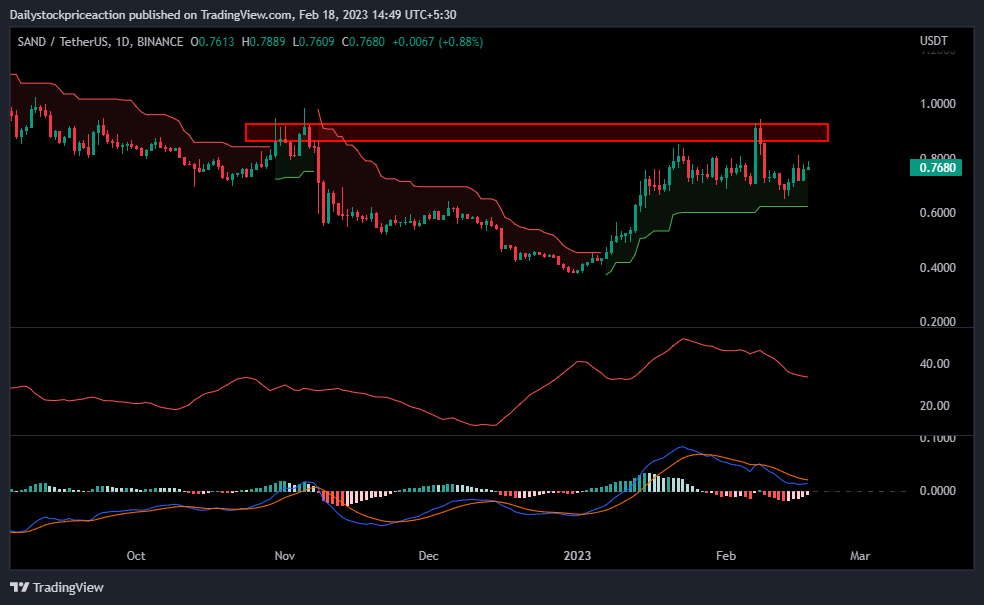
The SAND token price is forming a bullish chart pattern. Before the current movement, the token price was lying in the demand zone and a recent bullish movement has pushed the price as well as the ADX curve upwards. As of now, the ADX curve is hovering at the level of 36.82 passing the 25 mark level. The ADX curve has turned towards indicating a possible break in the current price structure which could result in the formation of a bullish price structure.
The SAND token price has been on an uptrend and the same is depicted by the MACD indicator. The blue line crossed the orange line on the upside indicating bullish momentum in the upcoming trading days. Once the token price breaks the supply zone, the MACD line can be seen widening supporting the trend. Investors should exercise caution as the token price can behave erratically until and unless it breaks the consolidation at the supply zone.
The SAND token price was facing a strong rejection from the super trend sell line which was acting as a strong supply zone, but recent movement broke it and now the super trend indicator has triggered a positive signal indicating. Moving upward the token price can be seen resting at the super trend buy line, which can act as a strong demand zone.
Conclusion: The SAND token price is bullish as per the price action and the same is shown by the technical parameters. However, the token price is yet to cross the supply zone, investors should wait for proper price action and then act accordingly.
Support: $0.65 and $0.61
Resistance: $0.75 and $0.86
Disclaimer
The views and opinions stated by the author, or any people named in this article, are for informational ideas only, and they do not establish financial, investment, or other advice. Investing in or trading crypto assets comes with a risk of financial loss.

Nancy J. Allen is a crypto enthusiast, with a major in macroeconomics and minor in business statistics. She believes that cryptocurrencies inspire people to be their own banks, and step aside from traditional monetary exchange systems. She is also intrigued by blockchain technology and its functioning. She frequently researches, and posts content on the top altcoins, their theoretical working principles and technical price predictions.


