
 Home
Home News
News

- Litecoin price prediction suggests that LTC crypto price has slipped below the rising parallel channel over the daily time frame chart.
- LTC crypto is falling towards 20, 50, 100 and 200-days Daily Moving Average.
- The pair of LTC/BTC was at 0.00402 BTC with an intraday drop of 0.52%.
According to the Litecoin price prediction 2023, the token’s maximum recovery will be $150 in 2023. The LTC coin displayed some strange patterns on the daily time frame chart. In the daily time chart, the price of Litecoin initially started to fall into a descending wedge and then momentarily stabilized. Following that, the LTC coin started to bounce back and joined an upward parallel channel. It is currently making an effort to support itself inside the channel so that it can continue to heal. Analysts from a significant cryptocurrency company forecast that LTC will increase to a price of $150 in 2023 if it maintains a price over $100.

Litecoin was trading at $98.17 and lost 1.50% of its market value throughout the day’s trading. The volume of trades during the intraday trading session has decreased by 31%. This shows that sellers are currently trying to drive LTC below the lower trendline of the rising parallel channel. Market capitalization as a percentage of volume was 0.07193.

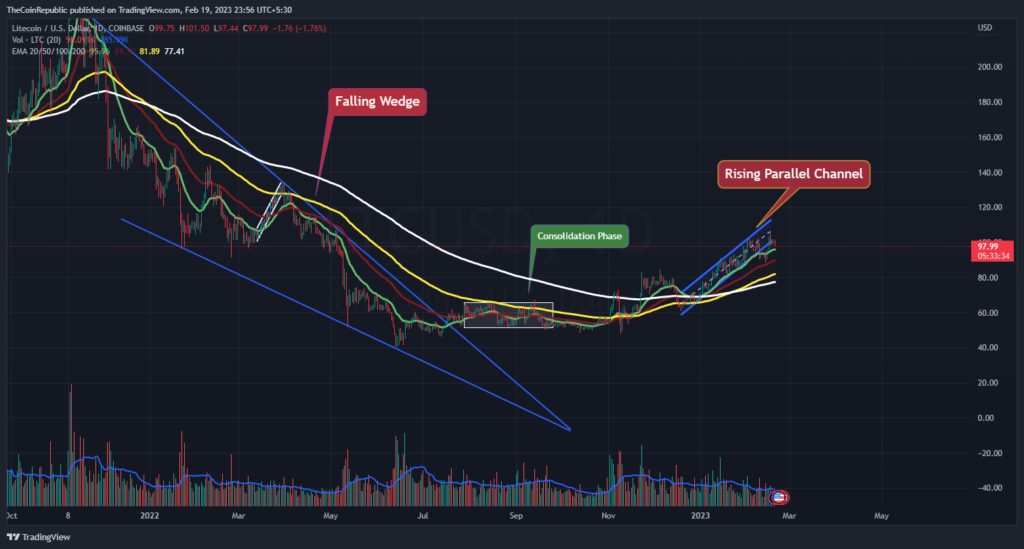
The Litecoin price prediction suggest that the LTC token price may rebound in 2023 with a strong upward momentum, according to the daily time frame chart. The parallel channel must be kept open for the recovery of LTC crypto. Volume change, on the other hand, seems to be below average and must rise for LTC to recover. LTC’s price is dropping and has now gone beneath the 20, 50, 100, and 200-day Daily Moving Averages.
Will Litecoin Price Start its Recovery?
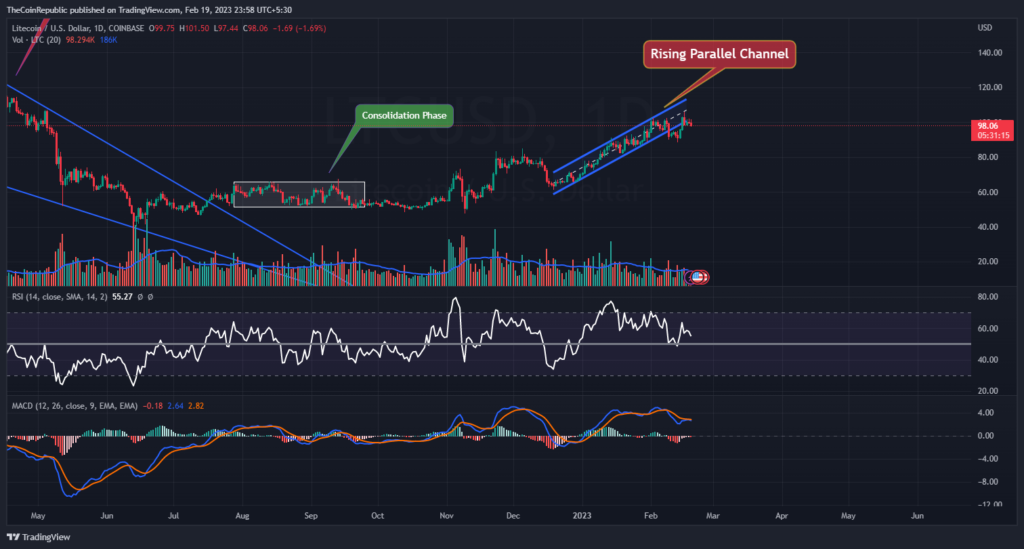
The Litecoin price prediction shows a daily time frame graphic of the token’s decline. Technical indicators suggest that the downward momentum of the token is below the parallel channel.
The relative strength indicator shows the momentum of LTC’s fall inside the channel. The RSI was heading towards neutrality when it reached a value of 55. The momentum of the LTC coin’s decrease can be seen on MACD. The MACD line and the signal line are about to cross negatively. LTC cryptocurrency investors should keep an eye on the daily time frame chart for any directional changes.
Summary
According to the Litecoin price prediction 2023, the token’s maximum recovery will be $150 in 2023. The LTC coin displayed some strange patterns on the daily time frame chart. In the daily time chart, the price of Litecoin initially started to fall into a descending wedge and then momentarily stabilized. Volume change, on the other hand, seems to be below average and must rise for LTC to recover. Technical indicators suggest that the downward momentum of the token is below the parallel channel. LTC cryptocurrency investors should keep an eye on the daily time frame chart for any directional changes.
Technical Levels
Support Levels: $95.00 and $90.00
Resistance Levels: $100.00 and $107.00
Disclaimer
The views and opinions stated by the author, or any people named in this article, are for informational ideas only, and they do not establish financial, investment, or other advice. Investing in or trading crypto assets comes with a risk of financial loss.

Andrew is a blockchain developer who developed his interest in cryptocurrencies while pursuing his post-graduation major in blockchain development. He is a keen observer of details and shares his passion for writing, along with coding. His backend knowledge about blockchain helps him give a unique perspective to his writing skills, and a reliable craft at explaining the concepts such as blockchain programming, languages and token minting. He also frequently shares technical details and performance indicators of ICOs and IDOs.


