
 Home
Home News
News
- Chainlink price prediction suggests that the LINK crypto might rally out of the long term consolidation phase over the daily time frame chart.
- LINK crypto has recovered above 20, 50, 100 and 200-days Daily Moving Average.
- Analysts from a big cryptocurrency firm speculate that the Chainlink price might rally maximum during 2023.
From May 2022, the token has been consolidating inside the long-term consolidation phase, according to Chainlink price prediction. During the long-term consolidation period of the daily price chart, the LINK cryptocurrency must ascend to the top. The LINK cryptocurrency needs to find customers in the meantime in order to rise and get through the consolidation stage. The price of the LINK cryptocurrency has been climbing significantly during the course of the daily time frame chart.

Chainlink’s market value, which is currently $8.02, has improved during the last day by 0.19%. Trading volume decreased by 6.85% during the intraday trading session. This implies that the intention of the dealers is to drag LINK cryptocurrency. For LINK to achieve its breakthrough a second time, the market cap to volume ratio must be 0.1362.

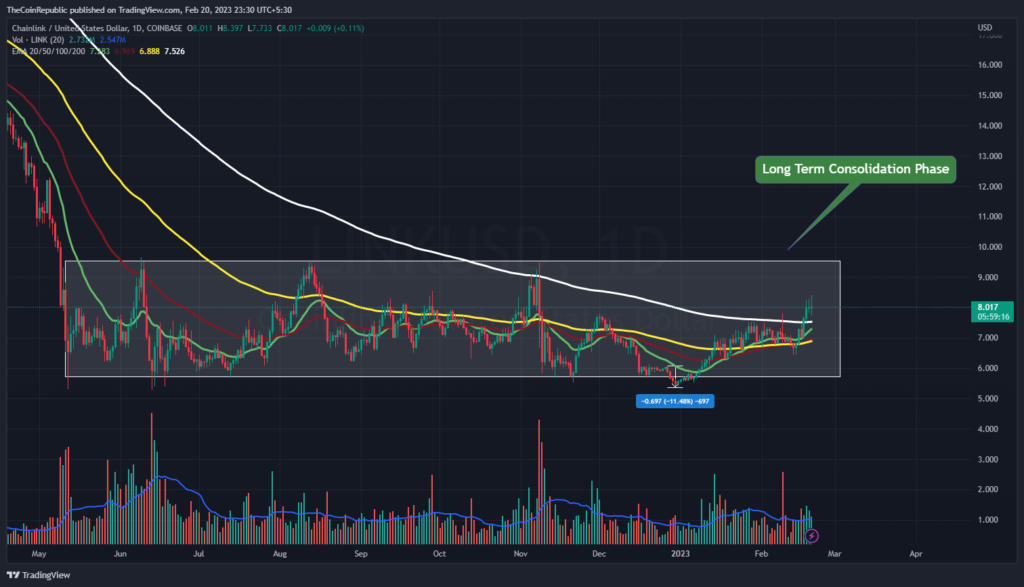
Chainlink price prediction suggests that the token might rally during 2023 says analysts. Investors in LINK cryptocurrency might witness maximum recovery of LINK during 2023 analysts added. However, trading volume has surged above average showcasing the accumulation rate of buyers. Meanwhile, LINK crypto has recovered above 20, 50, 100 and 200-days Daily Moving Average.
Will Chainlink Price Break Out of The Range?
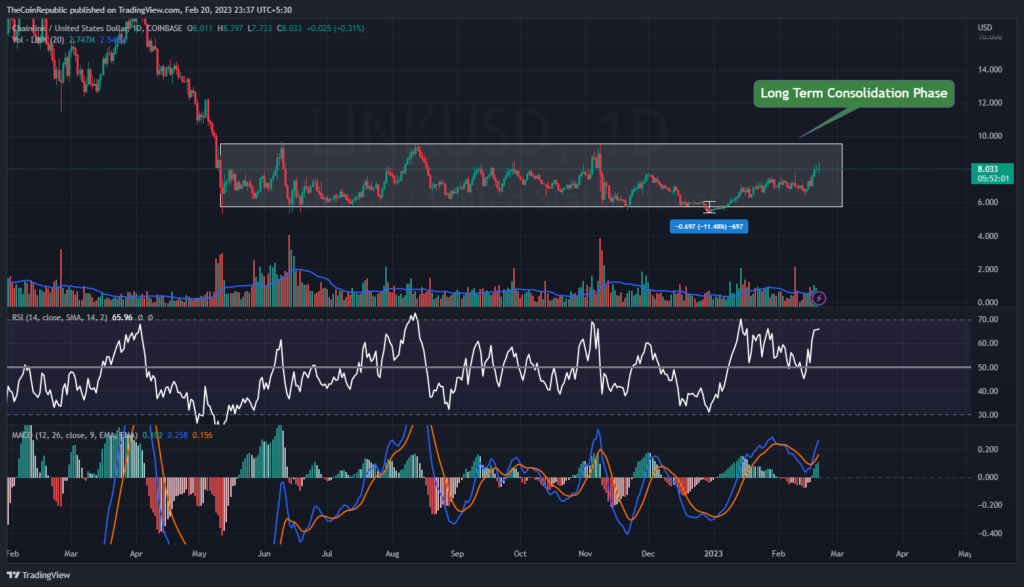
For the chainlink price to formally end the consolidation phase on the daily price chart, buyers must gather together. Technical indicators point to a sideways trend for the LINK cryptocurrency.
The LINK cryptocurrency’s consolidation period is depicted by the Relative Strength Index. At 65, the RSI is moving towards the overbought territory. The LINK cryptocurrency’s upward movement is shown on the MACD chart. In order to enter the higher price range of the consolidation phase, the MACD line must remain stable at this point that is above the signal line. Investors might experience a bullish rally of Chainlink price during 2023.
Summary
From May 2022, the token has been consolidating inside the long-term consolidation phase, according to Chainlink’s price projection. During the long-term consolidation period of the daily price chart, the LINK cryptocurrency must ascend to the top. However, trading volume has surged above average showcasing the accumulation rate of buyers. Technical indicators point to a sideways trend for the LINK cryptocurrency. Investors might experience a bullish rally of Chainlink price during 2023.
Technical Levels
Support Levels: $7.00 and $6.50
Resistance Levels: $8.50 and $10.00
Disclaimer
The views and opinions stated by the author, or any people named in this article, are for informational purposes only, and they do not establish financial, investment, or other advice. Investing in or trading crypto or stocks comes with a risk of financial loss.

Nancy J. Allen is a crypto enthusiast, with a major in macroeconomics and minor in business statistics. She believes that cryptocurrencies inspire people to be their own banks, and step aside from traditional monetary exchange systems. She is also intrigued by blockchain technology and its functioning. She frequently researches, and posts content on the top altcoins, their theoretical working principles and technical price predictions.


