
 Home
Home News
News

RVN is piling up the gains by gradually leaning the arms with soft volumes. Bulls gain momentum, attaining 12% in the last session. RVN trades beyond its significant moving averages and near the upper Bollinger band. The price action shows bullish cues with long buildup moves in the recent sessions. The buyers are accumulating the coin’s price by breaking the narrow range price action.

At the time of writing, RVN is trading at $0.03652 with a sharp gain of 12% intraday, While its pair RVN /BTC is at 0.000001494 satoshis. The trading volume increased by 19%, showing the interest of buyers.

Daily chart: the price is out of the congestion zone
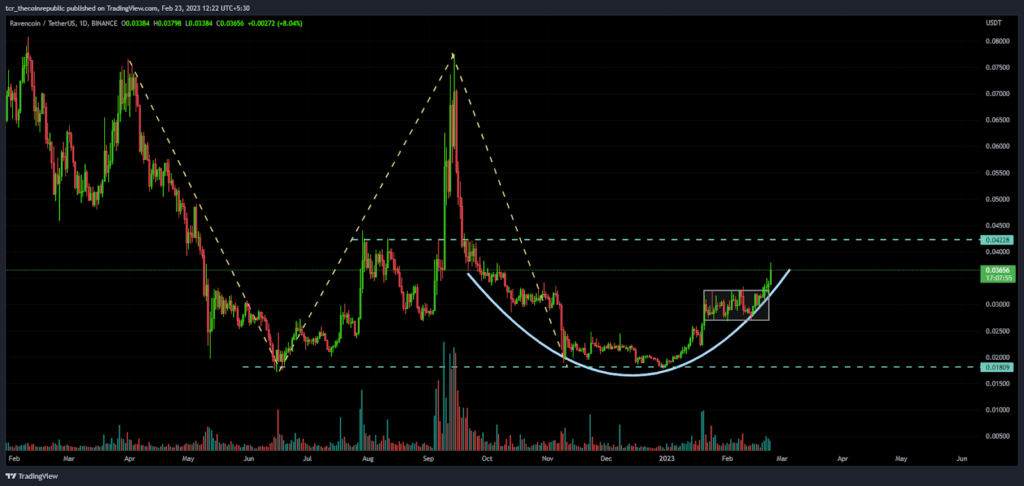
On the daily chart, Ravencoin forms a double bottom pattern setting its base near the support range of $0.01800. Moreover, the price action indicates that the price has been hovering over the past few months and completed its correction phase by consolidating in the narrow range. This creates a rounding bottom pattern on the chart while the bulls are trying to break the neckline at $0.04000. The bulls are preparing to attain further highs.
Ravencoin showed higher highs formation in the past three sessions attaining successive gains with decent volumes. Furthermore, the price action indicates the beginning of fresh buying and the beginning of an uptrend. For the past few months, coins have been in the hands of bears, but now bulls have the authority to lift the price. On the other note, price is on the upper bollinger band and willing to register a fresh breakout.
Short term chart shows “out of the box” moves
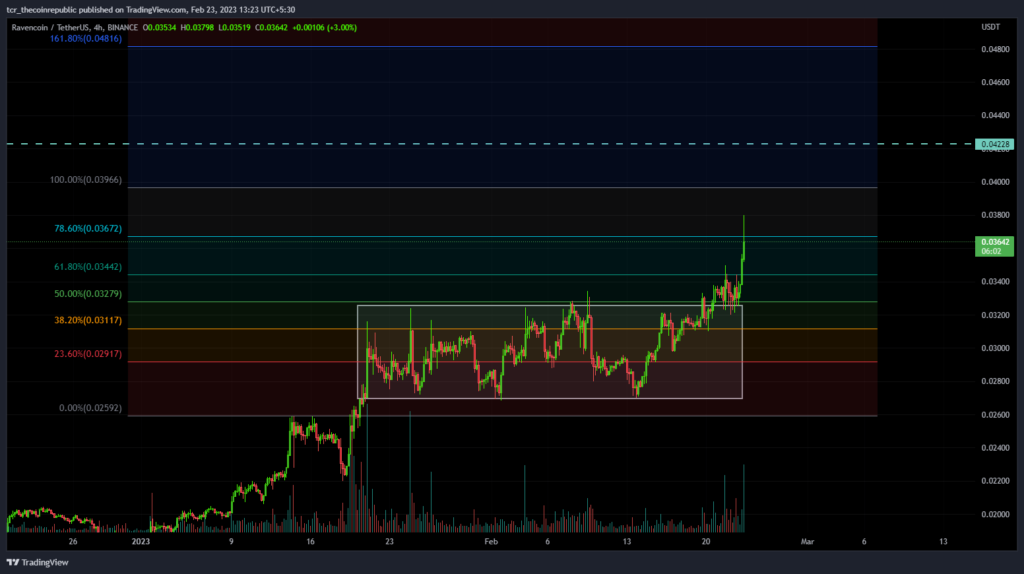
On the 4-hour chart, Ravencoin flees the narrow range moves and breaks the consolidation territory. The Fib levels indicate that during the last months, the price was poised in the mid-band between $0.02700 to $0.03000. Then RVN shows a bounce and gains traction by sustaining over 200- days EMA.
Moreover, the coin now refuses from 78.6% Fib Levels and pauses for a further pullback. Although, sellers have now remained cautious with the decisive moves this week.
Traditional indicators over RVN
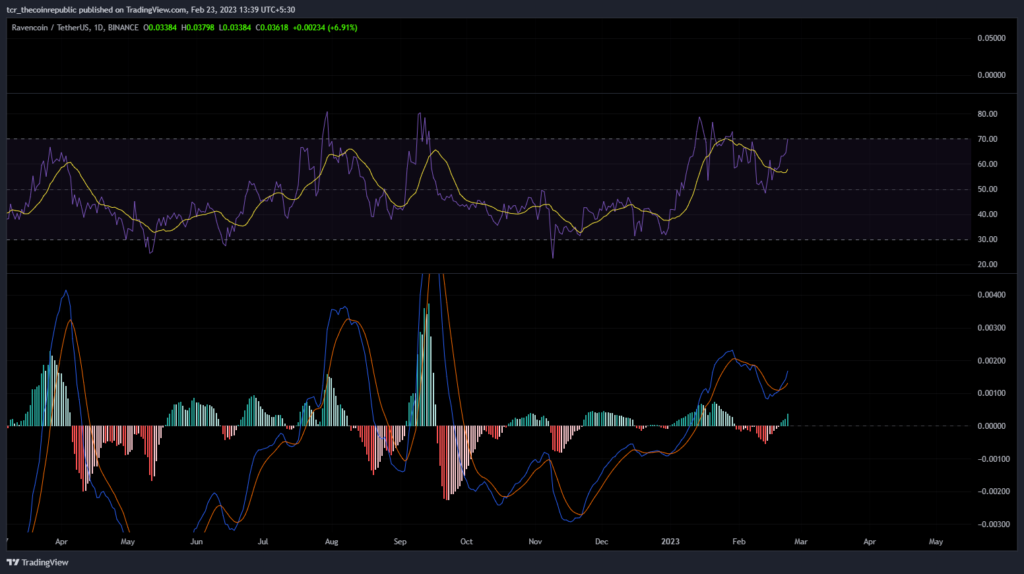
RSI: The RSI curve indicates buying action in the coin, plotting near 70.
It heads toward 75 and indicates that further buying actions may be seen in the upcoming sessions.
MACD: Bullish crossover was noted in the last few sessions. Moreover, the green bars are suggesting additional buying stir may be seen in upcoming sessions.
Technical Levels
Support Levels: $0.03000 and $0.02500
Resistance Levels:$0.04000 and $0.04200
Conclusion:
Ravencoin price reveals bullishness on the chart and is ruling toward its last swings of $0.04000.The recent breadth breakout makes the bulls gain more solidity to accomplish the buying goals. The coin made a base near $0.02000 and a pullback from that demand zone, while the supply zone exists near at $0.04000 where sellers are maintaining their positions.
Disclaimer
The views and opinions stated by the author, or any people named in this article, are for informational ideas only, and they do not establish financial, investment, or other advice. Investing in or trading crypto assets comes with a risk of financial loss.
Steve Anderson is an Australian crypto enthusiast. He is a specialist in management and trading for over 5 years. Steve has worked as a crypto trader, he loves learning about decentralisation, understanding the true potential of the blockchain.


