
 Home
Home News
News
- 1 ZIL price broke out of the 200 EMA with a strong momentum
- 2 ZIL price might make a small retest before continuing the trend
Zil price after taking heavy resistance from the 200 EMA has broken that resistance with strength near mid-February. Zilliqa, a layer 1 blockchain, is recently said to be creating a new standalone business called Roll1ng Thund3rz from its gaming division.
Zilliqa price broke the 200 EMA resistance (1-day timeframe )
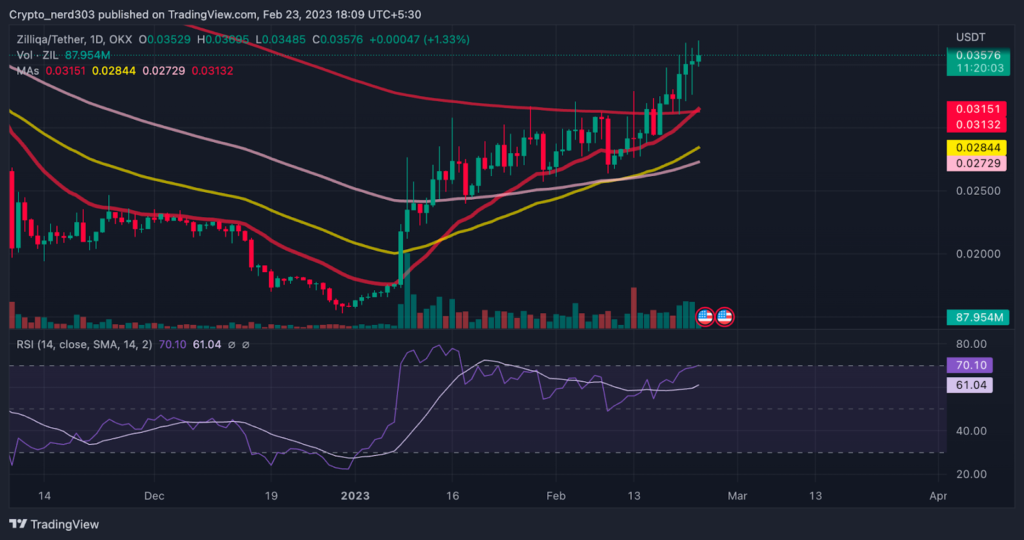
It seems like buyers agree with this statement as positive recent developments can be seen happening in the price action near the date the press conference happened and after that. While most of the chances are that the price might soon take a correction from its resistance which is acting as ZIL’s recent support.
Technical Analysis ( 4 Hour Timeframe )
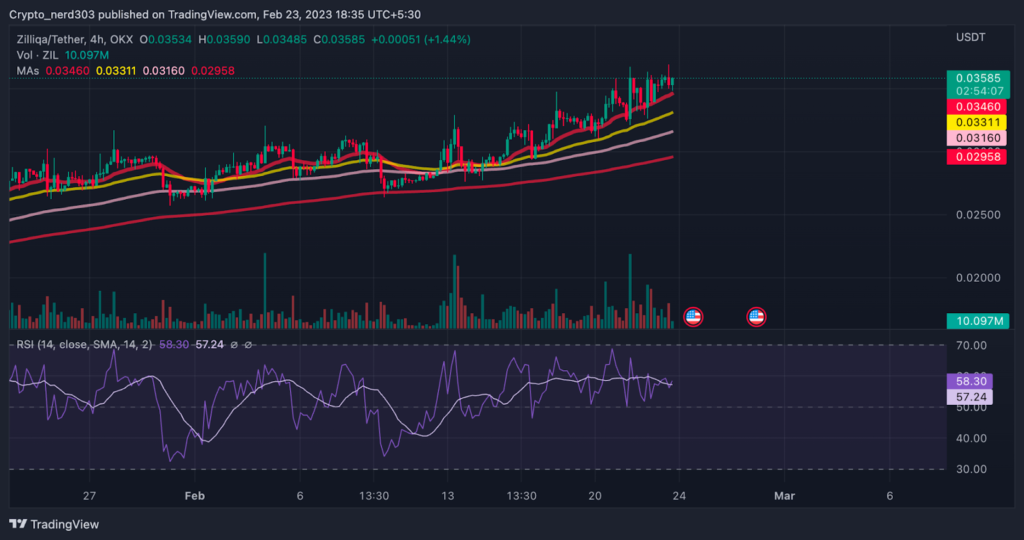
On the 4 Hour timeframe ZIL price is currently trading on a near-perfect uptrend where all the EMA’s are currently trading in ascending order and the ZIL price is constantly taking support from the 20 EMA while on the daily timeframe, the price has already crossed over the 200 EMA and the 20 EMA is currently at the edge of an intersection.
The Zilliqa price is currently taking support from the 20 and 50 EMA respectively around the price of $0.034 and $0.033 and the ZIL price is taking its recent resistance from the $0.037.
The RSI is currently trading a little above the median line taking support from the 14 SMA around the price of 58.45 while the 14 SMA is trading around point 57.23 while on the daily timeframe, the RSI line is trading near the overbought zone near the price 70.28 above the 14 SMA which is around 61.05 level.
Conclusion
ZIL price has been showing some bullish signs after the announcement regarding the new game launch which was given on 13 Feb. Zilliqa after recently breaking the 200 EMA on the daily timeframe is trading above it while on the 4 Hr time frame, ZIL price trading on a perfect bull trend above the key averages taking consistent support from the 20 and 50 EMA.
Although it is possible that the Zilliqa price might take a small correction and make a rebound from the 200 EMA as can be confirmed by the RSI indicator which is trading on the oversold levels on daily timeframe.
Technical levels –
Support – $0.034 and $0.033
Resistance – $0.037
Disclaimer
The views and opinions stated by the author, or any people named in this article, are for informational purposes only, and they do not establish financial, investment, or other advice. Investing in or trading crypto assets comes with a risk of financial loss.

With a background in journalism, Ritika Sharma has worked with many reputed media firms focusing on general news such as politics and crime. She joined The Coin Republic as a reporter for crypto, and found a great passion for cryptocurrency, Web3, NFTs and other digital assets. She spends a lot of time researching and delving deeper into these concepts around the clock, and is a strong advocate for women in STEM.


