
 Home
Home News
News

- 1 Ethereum Classic token was currently at $21.21 with an increase of 0.33% during the intraday trading session.
- 2 The 24-hour low of ETC was $20.39 and the 24-hour high of ETC was $21.24.
- 3 The current Ethereum Classic token price is between 100, and 200-Day EMA.
The pair of ETC/BTC was currently trading at 0.0009152 BTC with a rise of 0.04% over the intraday trading session.

Ethereum Classis price analysis suggests that it is currently in a consolidation phase. 2022 was a very volatile year for ETC. As the year started bulls took over the market making its new 52-week high, and soon after bears took back the market and made a new 52-week low. Then again bulls took over the market taking the token to its supply zone or distribution phase but again bears took over the market and forced the token to enter its demand zone or accumulation zone. And at the end of the year, bears pushed the token near its 52-week low.

2022 was a rollercoaster ride for the traders as well as for the investors.
After the start of 2023, the token was constantly rising until it broke its primary support, from there on it is consolidating between its primary resistance and support. If the token breakout of the consolidation is below its primary support then sellers will push back the token into its demand zone and if the token breakout above its primary resistance then buyers may push the token and help it break its secondary resistance. Traders should patiently watch the market for any significant move.
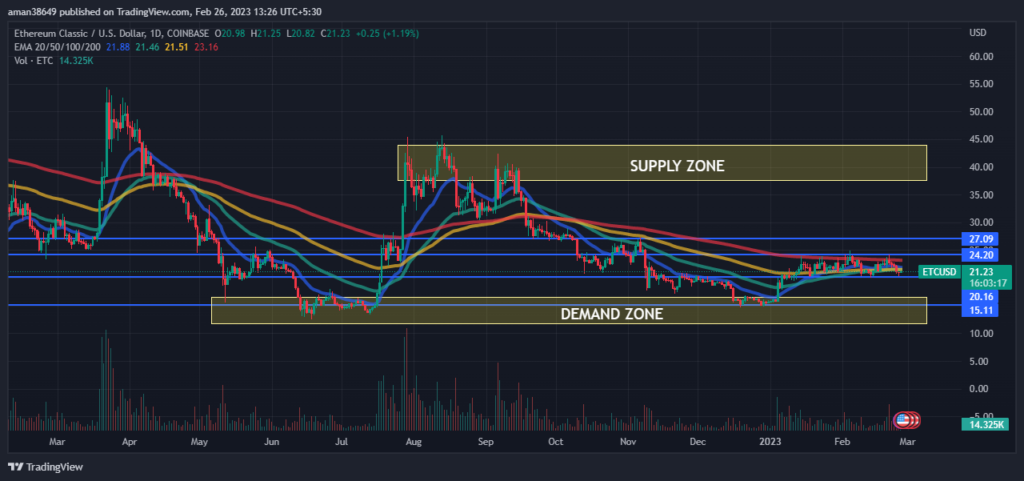
The volume of the coin has decreased by 19.84% in the last 24 hours. The decrease in volume indicates that the number of sellers has increased. This shows that sellers are trying their best and there is no relationship between volume and the price of ETC, which represents a weakness in the current downtrend or a possible reversal.
The technical analysis of Ethereum Classic
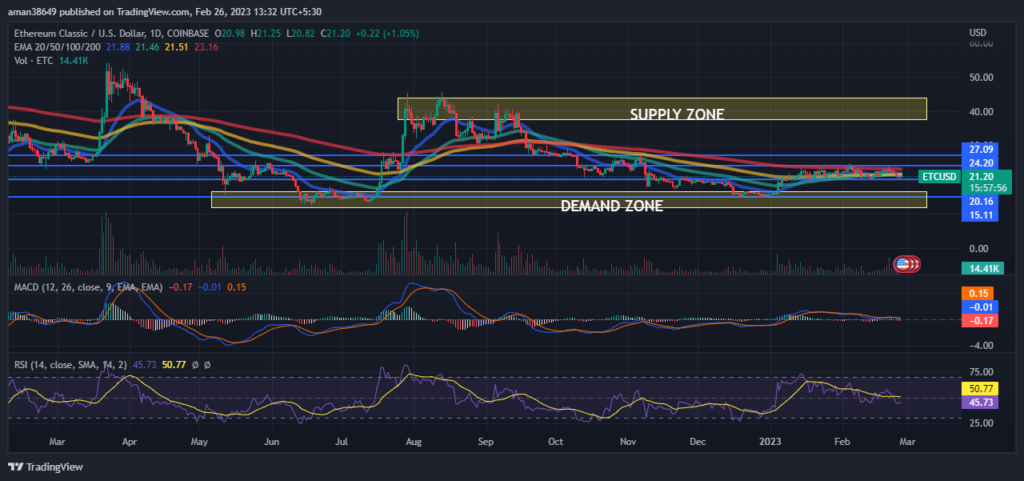
RSI is increasing in the oversold zone and is showing signs of a positive crossover which indicates that the buyers are coming in the majority and pushing ETC upwards. This suggests the strength of the current bullish trend. The current value of RSI is 45.73 which is below the average RSI value of 50.77.
The MACD and the signal line are decreasing and intersecting but not giving any definitive crossover or evidence to support the RSI claims. Investors need to watch every move over the charts during the day’s trading session.
Conclusion
Ethereum Classic price analysis suggests that it is currently in a consolidation phase. 2022 was a very volatile year for ETC. From the start of 2023, ETC started rising but soon after breaking its primary support the token became consolidated between its primary support and resistance, The decrease in volume shows a lack of confidence in traders. But RSI is increasing in an oversold zone which indicates strength in the bullish trend, as per the technical indicators. This only creates confusion among traders. Traders should wait for any significant move in the market before making any trades.
Technical Levels
Resistance level- $24.20 and $27.09
Support level- $20.16 and $15.11
Disclaimer
The views and opinions stated by the author, or any people named in this article, are for informational purposes only, and they do not establish financial, investment, or other advice. Investing in or trading crypto assets comes with a risk of financial loss.

Andrew is a blockchain developer who developed his interest in cryptocurrencies while pursuing his post-graduation major in blockchain development. He is a keen observer of details and shares his passion for writing, along with coding. His backend knowledge about blockchain helps him give a unique perspective to his writing skills, and a reliable craft at explaining the concepts such as blockchain programming, languages and token minting. He also frequently shares technical details and performance indicators of ICOs and IDOs.


