
 Home
Home News
News
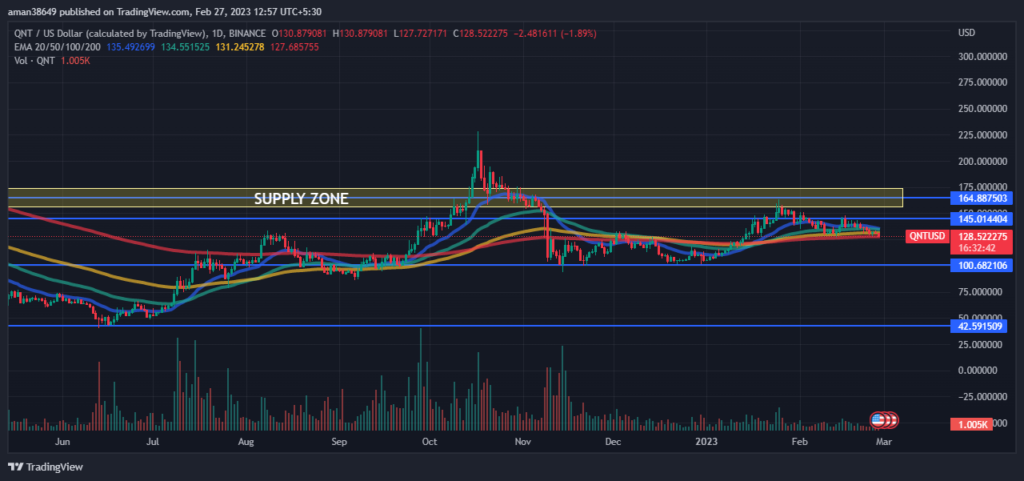
- Quant token was currently at $128.88 with a decrease of 2.29% during the intraday trading session.
- The 24-hour low of QNT was $128.14 and the 24-hour high of QNT was $133.75.
- The current Quant token price is between 100, and 200-Day EMA.
The pair of QNT/BTC was currently trading at 0.005498 BTC with a dip of 3.49% over the intraday trading session.
Quant price analysis suggests that the token is in a downtrend. 2022 was a very volatile year for the token as it was a rollercoaster ride for the token because of its lots of ups and downs. From April 2022 the token was in a downtrend and sellers force the token to make its new 52-week low but bulls came to its rescue and pushed it upwards and helping the token to reenter its supply zone or distribution phase. But at the end of 2022 sellers make a powerful entry into the market pushing back the token near its primary support and keeping it there till the end of the year.
After the start of 2023, the QNT token again started rising with the help of bulls coming back into the market breaking its primary resistance and reaching its secondary resistance but after the formation of an evening star chart pattern over the daily trading chart bears took over the market and the token started declining. Because the evening star pattern is a strong trend reversal chart pattern and indicates that the downtrend of the token is starting. This signals the long traders to end their trades. Now once again bulls needed to come to the rescue of the token.
The volume of the coin has increased by 36.16% in the last 24 hours. The increase in volume indicates that the number of buyers has increased. This shows that buyers are trying their best and there is no relationship between volume and the price of QNT, which represents a weakness in the current downtrend or a possible reversal.
The technical analysis of Quant:
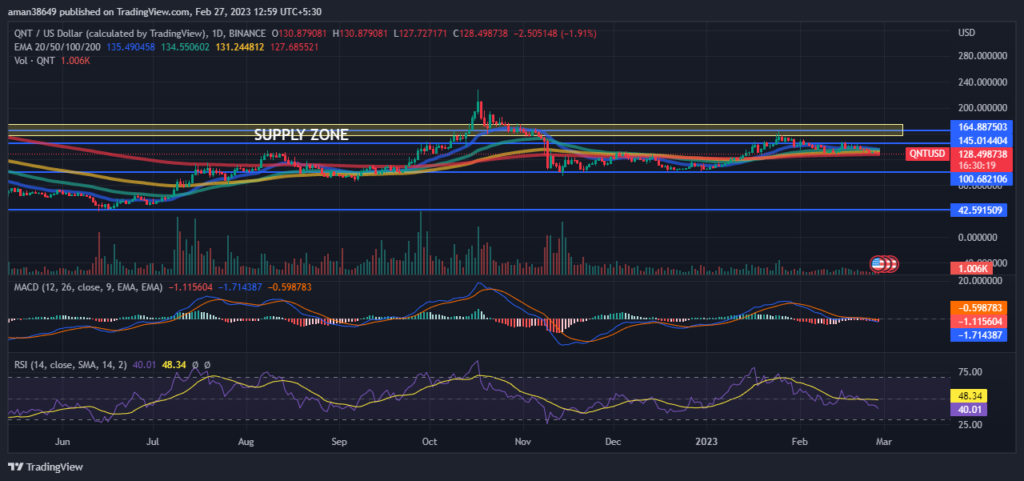
The MACD and the signal line are decreasing and intersecting but not giving any definitive crossover or evidence to support the RSI claims. Investors need to watch every move over the charts during the day’s trading session.
Conclusion
Quant price analysis suggests that the token is in a downtrend. After experiencing high volatility in 2022 the token tried to remain stable after the start of 2023 but looks like that can’t happen. After the formation of the evening star pattern over the daily trading chart, the token started declining. RSI and MACD both are declining and show negative crossover over the daily chart which shows the strength in the current downtrend, as per the technical indicators. Long traders should end their trades and short traders can make use of this good opportunity in the market.
Technical Levels-
Resistance level- $145.01 and $164.88
Support level- $100.682 and $42.591
Disclaimer-
The views and opinions stated by the author, or any people named in this article, are for informational purposes only, and they do not establish financial, investment, or other advice. Investing in or trading crypto assets comes with a risk of financial loss.

Andrew is a blockchain developer who developed his interest in cryptocurrencies while pursuing his post-graduation major in blockchain development. He is a keen observer of details and shares his passion for writing, along with coding. His backend knowledge about blockchain helps him give a unique perspective to his writing skills, and a reliable craft at explaining the concepts such as blockchain programming, languages and token minting. He also frequently shares technical details and performance indicators of ICOs and IDOs.


