
 Home
Home News
News

- The Aave token was currently at $78.90 with a decrease of 2.81% during the intraday trading session.
- The 24-hour low of AAVE was $78.27 and the 24-hour high of AAVE was $83.40.
- The current Aave token price is between 100, and 200-Day EMA.
The pair of AAVE/BTC was currently trading at 0.003375 BTC with a dip of 2.68% over the intraday trading session.

Aave price analysis suggests that it is currently in a bearish phase. 2022 was not a very good year for the token. After making its 52-week high the token mostly remained in the hands of sellers. This can be seen in the daily chart as the token remained below its second year and traded near its primary support which indicates that the sellers have the upper hand over the buyers in the market. Near the end of the year, sellers forced the token to enter its demand zone or accumulation phase and kept the token in the demand zone until the end of the year. But after the start of 2023, buyers took back the market from sellers and pushed the token upwards helping the token to break its primary support.

Soon after breaking its primary support of $77.78, the token started consolidating between its primary support and resistance. This indicates that both buyers and sellers are in a stalemate which shows that no one has the upper hand in the market. If sellers took over the market then they may try to pull back the token to its demand zone. This can put the token in critical condition, if this happens buyers will have to come to the rescue of the token.
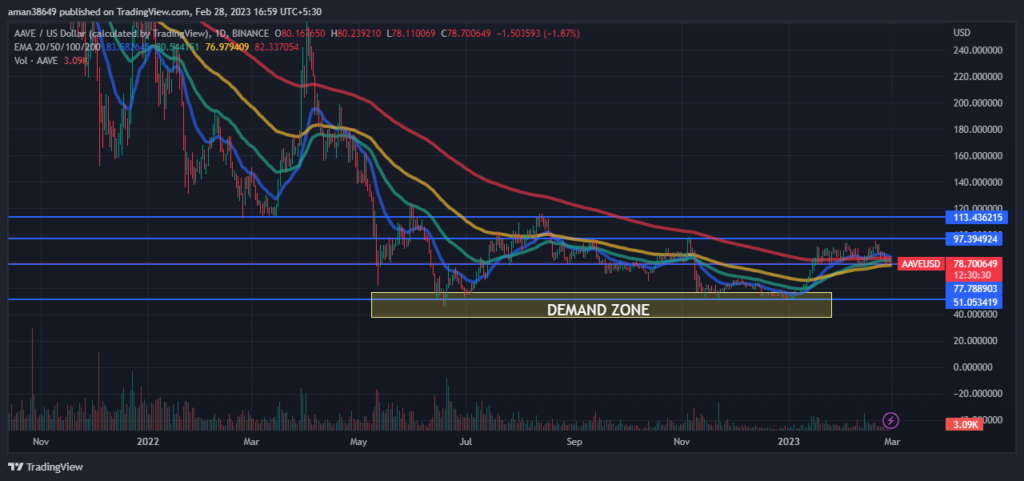
The volume of the coin has increased by 27.72% in the last 24 hours. The increase in volume indicates that the number of buyers has increased. This shows that buyers are trying their best and there is no relationship between volume and the price of AAVE, which represents a weakness in the current bullish phase or a possible reversal.
The technical analysis of Aave:
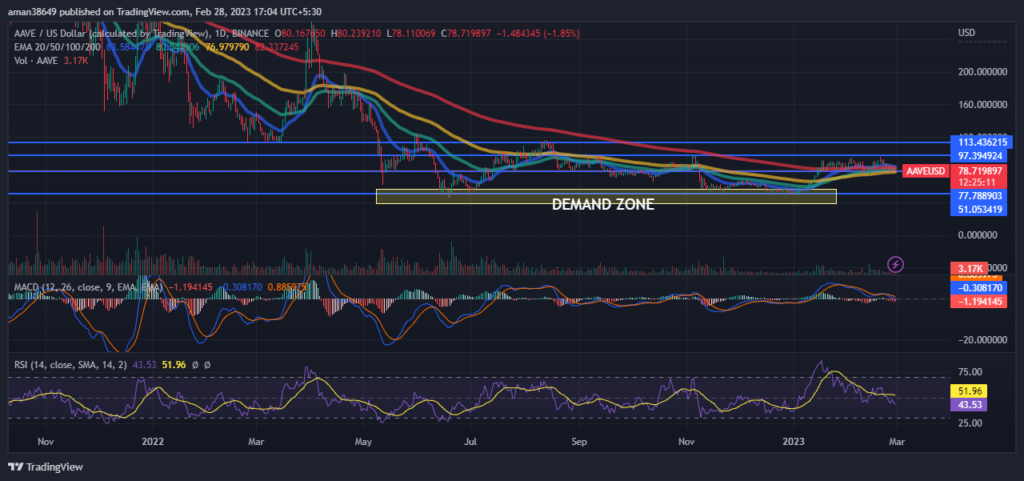
RSI is decreasing in the oversold zone and is shown a negative crossover which indicates that the sellers are coming in the majority and pushing AAVE downwards. This suggests the strength of the current bearish trend. The current value of RSI is 43.56 which is below the average RSI value of 51.96.
The MACD and the signal line are decreasing and intersecting and showing a negative crossover which supports the RSI claims. Investors need to watch every move over the charts during the day’s trading session.
Conclusion
Aave price analysis suggests that it is in a bearish phase. 2022 was not a very good year because after the token made its 52-week high it mostly traded bearish its demand zone and made multiple entries to its demand zone throughout the year. After the start of 2023 token started rising but started consolidating soon after breaking its primary support. RSI and MACD both are decreasing and showing a negative crossover which indicates strength in the current bearish phase. Traders should wait for any significant move over the trading chart.
Technical Levels-
Resistance level- $97.39 and $13.43
Support level- $77.887 and $51.053
Disclaimer-
The views and opinions stated by the author, or any people named in this article, are for informational purposes only, and they do not establish financial, investment, or other advice. Investing in or trading crypto assets comes with a risk of financial loss.
Steve Anderson is an Australian crypto enthusiast. He is a specialist in management and trading for over 5 years. Steve has worked as a crypto trader, he loves learning about decentralisation, understanding the true potential of the blockchain.


