
 Home
Home News
News
- 1 Hycroft Mine, Nevada, is one of the world’s richest gold and silver deposits.
- 2 The next earrings date is March 30, 2023.
Hycroft Mining Holding Corporation is a United States-based gold and silver development company owned by Hycroft Mine, Nevada. The mine sits atop the richest gold and silver deposits in the world. The company focuses on completing technical studies for transiting Hycroft into large-scale milling operations for processing sulfide ore.
The company also engages in exploration drill programs targeted to higher-grade material identified by their work in 2021. They are permitted for both heap leach and milling operations. They have extensive infrastructure on their sites, including leach pad capacity, crushing facilities, and two Merril Crowe plants with a refinery.
HYMC – Price Analysis
At the time of writing, it was trading at $0.3675 with a drop of 5.50%; previous close and open were at $0.3889 and $0.3980, respectively. The fifty-two-week change is 32.31%. The market cap is $73.6 million, with a volume of 4.36 million shares and an average volume of 2.77 million shares. The profit margin is negative 205.63%, while the operating margin is negative 172.57%.
The company’s revenue is $45.78 million, with a correction of 72.35% year-on-year. Quarterly revenue growth is negative 72.40%, and the gross profit is negative $50.95 million. The company’s net income is negative $15.85 million, with a jump of 31.72%. At the same time, EPS is negative $0.08, with a jump of 78.44%. The next earnings date of the company is March 30, 2023.
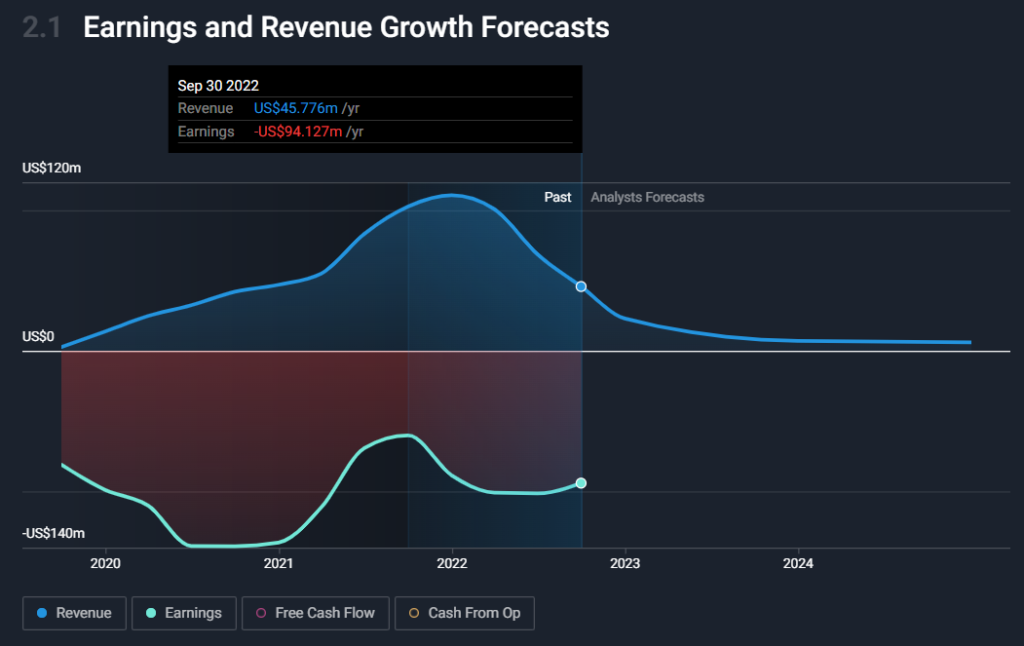
An earnings forecast is in the red zone below $0, around negative $94.127 million; at the same time, its revenue could be around $45.776 million.
Mudrick Capital Cuts Stake in HYMC
Mudrick Capital Management filed a 13D/A form with the Securities and Exchange Commission, where they disclosed the ownership of 20.16MM shares of HYMC, representing 9.8% of the company. According to previous filings on February 2, 2023, they held 27.49 MM shares and 12.90% of the company. There’s a total decrease of 26.66% in shares and 3.10% in ownership.
HYMC – Chart Analysis
A clear downward-sloping trend indicated a bearish trend; the moving average supports the suggestion in the same direction. The MACD also shows downward crossing lines, further intensifying the bear trend.
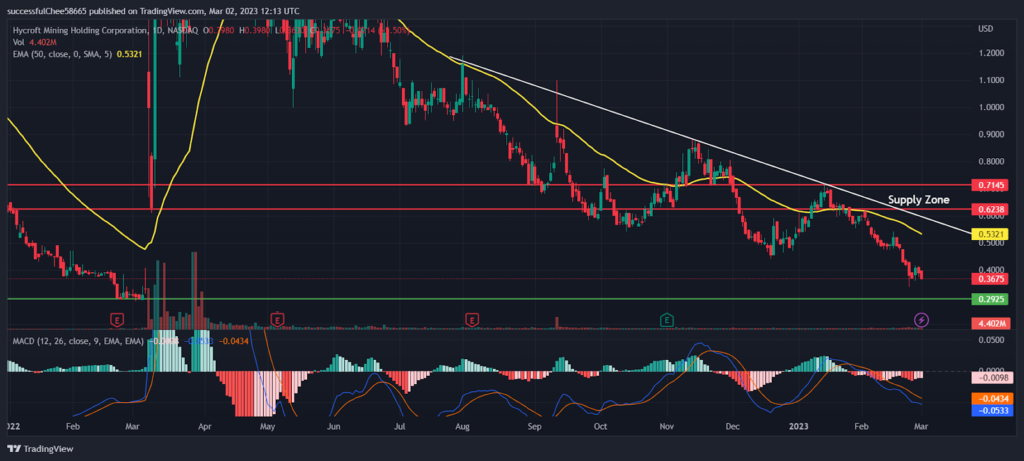
If the trend continues, it might test its support at $0.2925; whether it would go down further or bounce back is debatable. If the trend reverses, it would first test the moving average mark at $0.5321, and the trendline might consolidate in the region before entering the supply zone.
Disclaimer:
The views and opinions stated by the author, or any people named in this article, are for informational purposes only and do not establish financial, investment, or other advice. Investing in or trading crypto assets comes with a risk of financial loss.

Andrew is a blockchain developer who developed his interest in cryptocurrencies while pursuing his post-graduation major in blockchain development. He is a keen observer of details and shares his passion for writing, along with coding. His backend knowledge about blockchain helps him give a unique perspective to his writing skills, and a reliable craft at explaining the concepts such as blockchain programming, languages and token minting. He also frequently shares technical details and performance indicators of ICOs and IDOs.


