
 Home
Home News
News
- 1 MAGIC token price had been on an uptrend from the past couple of trading days but recently it failed to surpass an important supply zone on daily time frame.
- 2 MAGIC token price is forming a double top pattern on a daily time frame.
- 3 At present, the pair of MAGIC/BTC is trading at the price level of 0.00006682 with a decrease of -0/90% in the past 4 hours.
MAGIC token price as per the price action is bearish on a daily time frame and on a weekly time frame the token price is consolidating inside a small range after showing a strong bullish trend. As of now the MAGIC token price is transacting at the price level of 1.568. On a smaller time frame the token price is still bullish.
MAGIC token price is bearish on a daily time frame
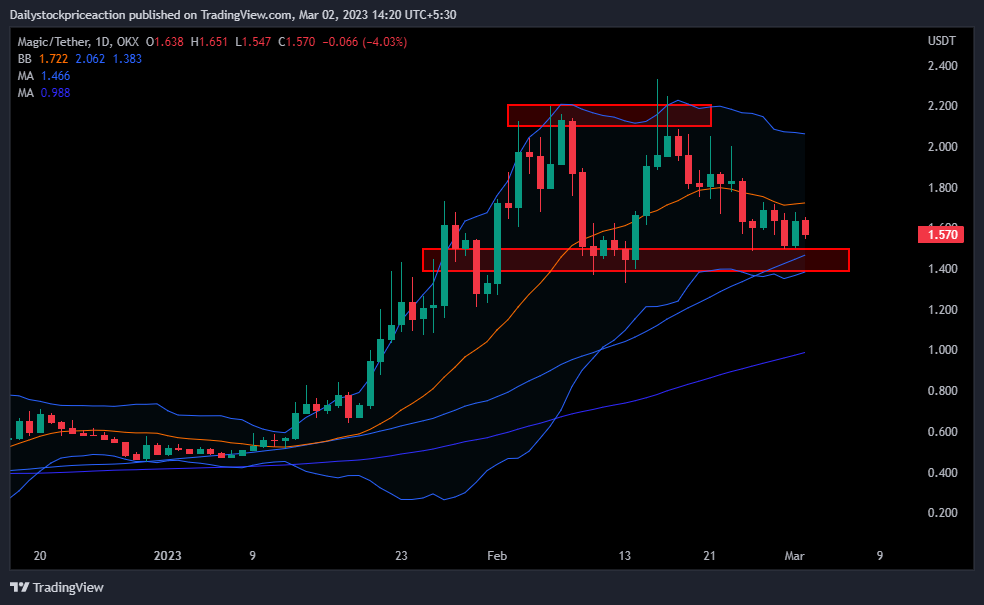
MAGIC token price as per the price action, seem ready for a big move after facing strong rejection from the important supply zone on a daily time frame. Prior to the current movement the token price was trading at the supply zone and now after a strong bearish move in the past week it has fallen to the important 50 and 100 Moving Averages, Moving upwards these MAs can be seen acting as a strong demand zone.
At present. The MAGIC token price is trading at the middle of the bollinger band indicator after showing a bearish pressure from the upper band. It has also gone past the 15 EMA exhibiting a strong bullish pressure if it retests the EMA successfully. Volumes have consolidated as the token price fell to the long term demand zone. It remains to see if the token price will break the demand zone or take support and bounce off it.
MAGIC token price is forming a double top pattern on a daily time scale
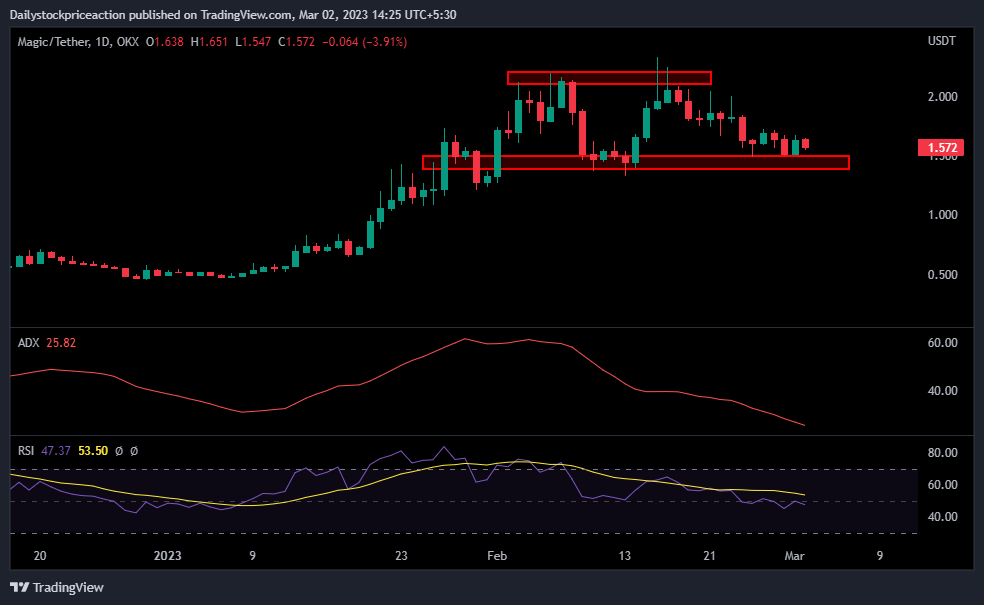
Average Directional Movement Index is seen following the trend of the token price movement. Following the strong bearish pressure it has started falling as it turned bearish. As of now, the MAGIC token price is falling below the mark of 30 indicating a strong bearish pressure. Although the ADX curve has turned sideways indicating a possible halt in the price movement and change in the price structure in the upcoming trading days.
Relative Strength Index curve is showing a strong hold off the bears as it managed to sustain at the higher level despite a strong bearish pressure in the past couple of trading days. As of now the RSI curve is transacting at the price level of 47.37. It is yet to surpass the halfway mark of 50 and once it does so the token price can be seen bouncing off the demand zone with a strong bullish pressure.
Conclusion: MAGIC token price as seen on a daily time frame is managing to sustain above the demand zone, the technical parameters are indecisive as it shows a neutral trend. As the token price forms a bearish price structure it remains to see if the token price will break the demand zone or hold off the bearish pressure and bulls take the charge.
Support: $1.3 and $1.1
Resistance: $2.1 and $2.6
Disclaimer
The views and opinions stated by the author, or any people named in this article, are for informational purposes only, and they do not establish financial, investment, or other advice. Investing in or trading crypto assets comes with a risk of financial loss

Nancy J. Allen is a crypto enthusiast, with a major in macroeconomics and minor in business statistics. She believes that cryptocurrencies inspire people to be their own banks, and step aside from traditional monetary exchange systems. She is also intrigued by blockchain technology and its functioning. She frequently researches, and posts content on the top altcoins, their theoretical working principles and technical price predictions.


