
 Home
Home News
News
- CHZ token price has managed to sustain at the demand zone despite an erratic movement in the global currency market.
- CHZ token price is forming a symmetrical triangle pattern on a daily time frame.
- The pair of CHZ/BTC is trading at the price level of 0.00000563 with a decrease of -1.25% in the past 24 hours.
CHZ token price as per the price action is neutral as it managed to sustain at the demand zone following a strong fall from the resistance. As of now, the token price is forming a higher high and higher low price formation on a daily time frame while on a smaller time frame the token price has turned bearish.
CHZ token price seems indecisive
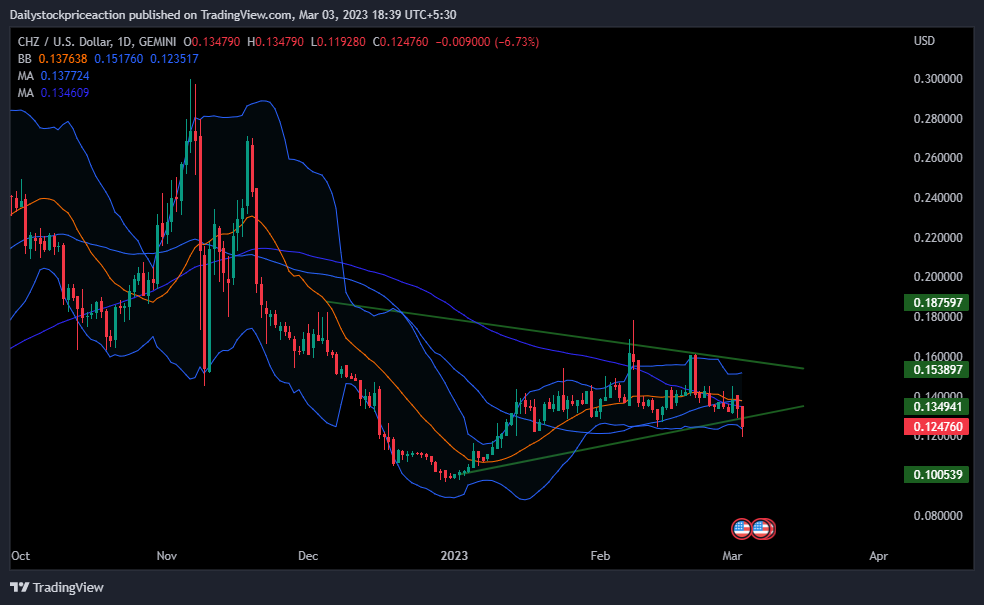
CHZ token price as per the price action has been strongly offsetting the nearish pressure from the bears. The token price has been trading above the important 50 and 100 MAs. This came after the token price broke the MAs during the previous bullish move. As of now, the token price is now resting at these MAs acting as a strong demand zone. If the bulls do not overpower the bears the token price can be seen breaking the MAs turning bearish.
CHZ token price is trading at the lower band of the bollinger band indicator after failing to surpass the upper band. Although the token price had surpassed the 15 EMA important line but recent fall in the price of the CHZ token has led to the breakdown of this EMA. Volumes have increased as the token price showed a strong fall. Investors therefore should remain cautious and wait for a clear trend and then act accordingly.
CHZ token price is forming a double top pattern on a daily time frame
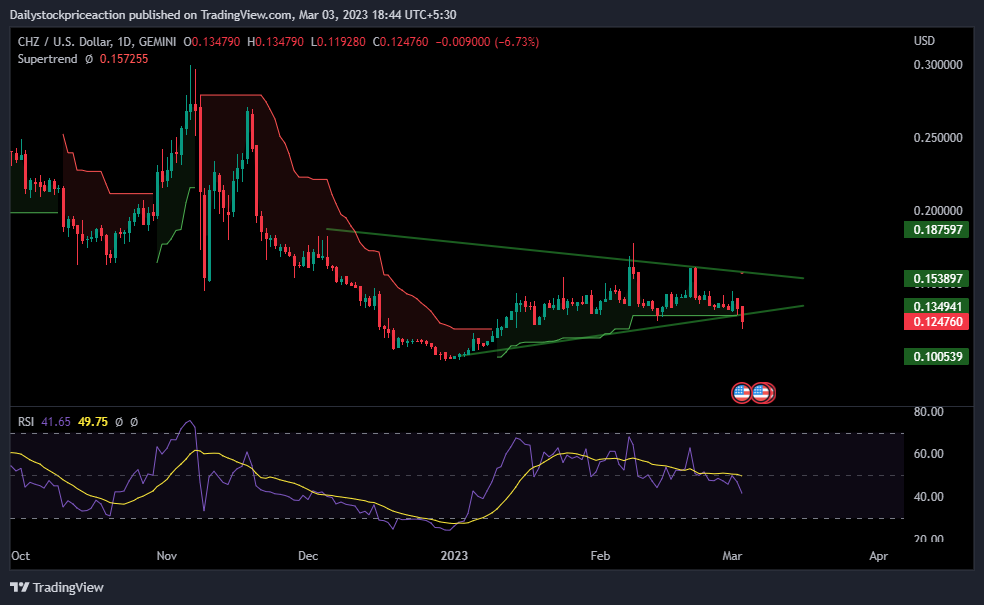
As the CHZ token price started falling to the demand zone after facing a strong pressure from the bears at the resistance the RSI curve was also seen falling. As of now, the RSI curve is transacting at the level of 41.65. If the token price does not bounce off the current demand zone the RSI curve can be seen falling further. As of now, the RSI curve is yet to cross the halfway mark of 50 and once it does the token price can be seen again moving upwards.
CHZ token price is turning bearish as the supertrend indicator suggests. Previously, during the bullish run the supertrend indicator triggered a strong buy signal which resulted in the formation of the supertrend buy line but recent breakdown has led to the supertrend buy line breaking and the formation of the supertrend sell line. Moving upwards this line can be seen acting as a strong supply zone.
Conclusion: CHZ token price as per the price action is bearish on a smaller time frame while on a larger time frame it is otherwise. The technical parameters are also suggesting a bearish trend to prevail in the market. The investor should remain cautious and wait for a breakout on either side and then act accordingly.
Support: $0.12 and $0.10
Resistance: $0.16 and $0.18
Disclaimer
The views and opinions stated by the author, or any people named in this article, are for informational ideas only, and they do not establish financial, investment, or other advice. Investing in or trading crypto assets comes with a risk of financial loss.
Steve Anderson is an Australian crypto enthusiast. He is a specialist in management and trading for over 5 years. Steve has worked as a crypto trader, he loves learning about decentralisation, understanding the true potential of the blockchain.


