
 Home
Home News
News

Lucid Group Inc. is a leading EV maker facing intense selling pressure in recent months. LCID stock reported mixed numbers in Q4 earnings of 2022, surprising investors with a major decline in revenues for the third consecutive time by a cut of 14%. The reported revenue was $257.71 million, but analyst estimates were $302.61 million.

LCID trades below all the significant moving averages and bears aggressively struck the stock price in the last weeks. LCID trades in the descending channel and continues to form lower lows near immediate crucial support of $8.00. Moreover, Lucid stock price is near its 52-week low of $6.09, which it might retest soon in the near months.

Lucid stock fell by more than 20% in the last 10 trading sessions, indicating bearishness in price action. The bulls cannot achieve stability and break intermediate support in a row.
Will LCID stock retest 52-week lows?
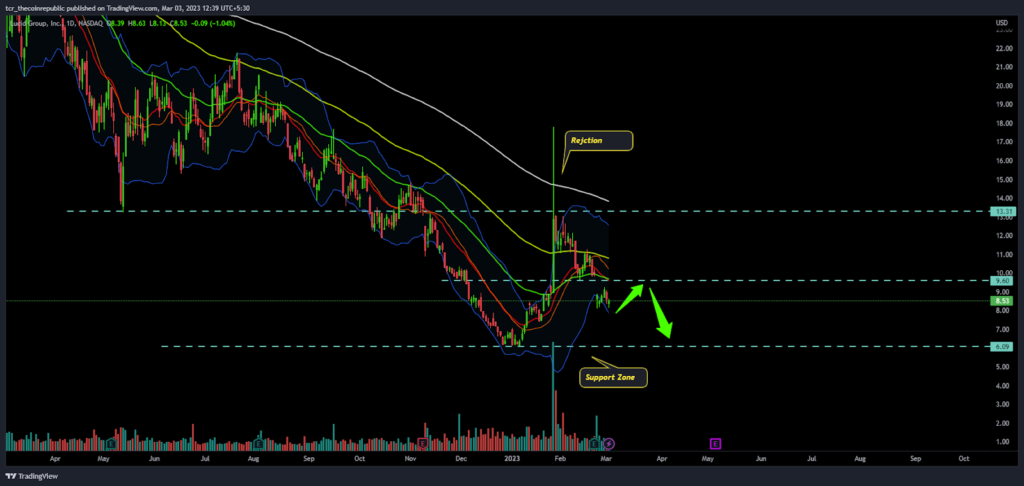
Lucid stock is trading on the paws of the lower Bollinger band, and if it breaks the immediate support of $8.00, bears might not stop until they strike $5.50. Despite the trend, an upside gap remains to be filled, and bulls are trying to seal it which is an ideal criteria for a further retracement as per the price action.
LCID share price was at $8.47 during yesterday’s market hours, with a cut of 0.70%. With sectoral downside moves, LCID stock is behaving like most other major sectoral stocks. Most of the stocks in the sector are in bearish zones and are near 52-week lows. Meanwhile, bulls try to hold the selling pressure by forming a hammer candlestick on the bottom. However, Fib levels also show that the price is already correcting from recent sessions and is near the bottom support, where an initial bounce can be expected from these levels. The last three daily candles project that bulls attempted to halt the selling pressure and persist in bouncing back.
The short-term view of LCID
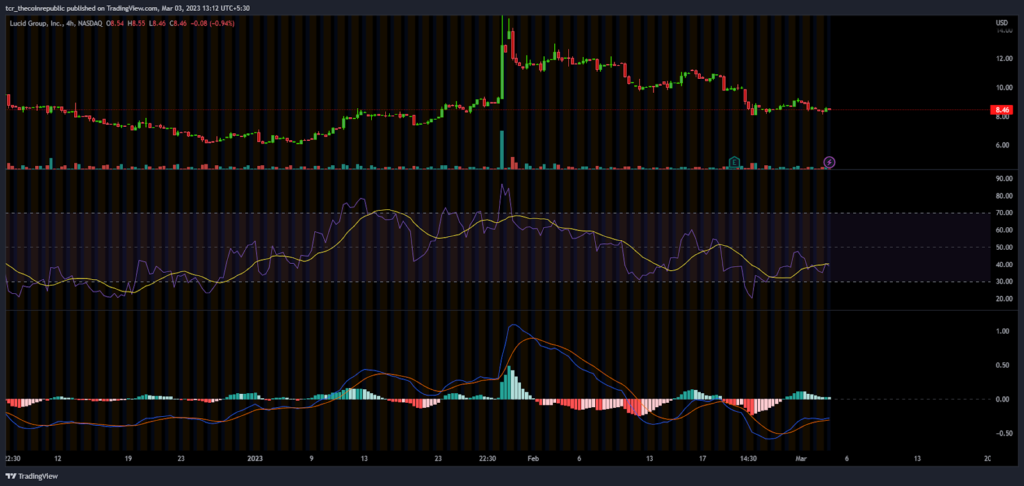
LCID stock on the 4-hour chart forms a double-bottom pattern with an upside trajectory of $10.00. Moreover, the Bolinger band also indicates a bigger move in upcoming hours as it converges and has a narrow range.
The RSI (Relative Strength Index) curve exhibits a positive divergence with the hope of recovering to retest the 20 days EMA. Meanwhile, it is near 35 and attempting a bounce to catch neutral range.
The MACD indicator indicates that the green bars are near an end and both the curves also converge which indicates that crossover is near to register. Moreover, the curve is fleeting in oversold and negative territory which means a bounce may be seen in near term.
Support levels: $7.30 and $6.00
Resistance Levels: $9.30 and $10.00
Conclusion
Lucid share is being dominated by the bears while the bulls try to fight back. The stock price continues to descend and has declined by more than 50% over the last six months.
Disclaimer
The views and opinions stated by the author, or any people named in this article, are for informational purposes only, and they do not establish financial, investment, or other advice. Investing in or trading crypto assets comes with a risk of financial loss.

Andrew is a blockchain developer who developed his interest in cryptocurrencies while pursuing his post-graduation major in blockchain development. He is a keen observer of details and shares his passion for writing, along with coding. His backend knowledge about blockchain helps him give a unique perspective to his writing skills, and a reliable craft at explaining the concepts such as blockchain programming, languages and token minting. He also frequently shares technical details and performance indicators of ICOs and IDOs.


