
 Home
Home News
News
- 1 The Synthetix token was currently at $2.89 with an increase of 1.02% during the intraday trading session.
- 2 The 24-hour low of SNX was $2.84 and the 24-hour high of SNX was $3.05.
- 3 The current Synthetix token price is below 20, 30, 100, and 200-Day EMA.
The pair of SNX/BTC was currently trading at 0.0001232 BTC with a rise of 2.36% over the intraday trading session. Synthetic price analysis suggests that the coin is currently in a bullish trend. 2022 was a very volatile year for the token as the token experienced many ups and downs. But the coin was mostly dominated by sellers which can be seen over the chart as the coin price decreased over the year.

Bulls tried to maintain the coin above its secondary resistance but sellers pushed back the coin below its secondary resistance of $3.376. Then buyers again tried to push the coin above its secondary resistance but sellers again took back the market. This pushed the coin downwards and near the end of the year sellers forced the coin to trade near its 52-week low.
After the start of 2023, the coin again started rising but after breaking its primary support of $2.222 the coin began consolidating between its primary support and resistance. After the formation of the Spinning top candlestick pattern over the daily trading chart, the coin started its bullish phase. Buyers pushed the coin helping it to break its primary resistance and resulting in breaking the consolidation phase.

The volume of the coin has increased by 8.33% in the last 24 hours. The increase in volume indicates that the number of buyers has increased. This shows that buyers are trying their best and there is a relationship between volume and the price of SNX, which represents strength in the current bullish phase.
The technical analysis of Synthetix
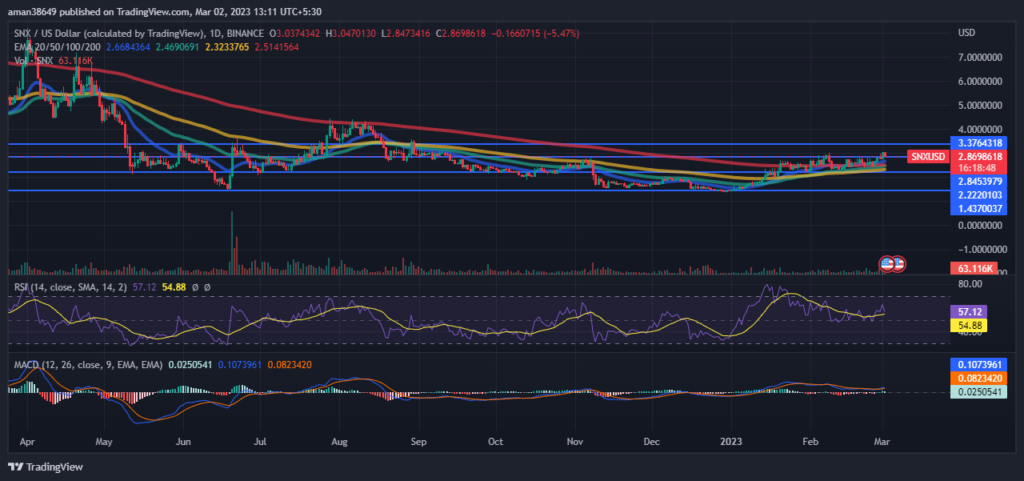
RSI is decreasing in the overbought zone and is showing signs of a negative crossover which indicates that the sellers are coming in the majority and pushing SNX downwards. This suggests the weakness of the current bullish trend. The current value of RSI is 57.02 which is above the average RSI value of 54.87.
The MACD and the signal line are stranded near the 0 value over the daily chart which does not provide any evidence to support the RSI claims. Investors need to watch every move over the charts during the day’s trading session.
Conclusion
Synthetix price analysis suggests that the coin is currently in a bullish phase. 2022 was a very volatile year for the token. The sellers kept the coin near its 52-week low near the end of the year. After the start of 2023 token again started rising but after breaking its primary support the token began consolidating. The increase in the volume indicates a positive sentiment toward the token. But RSI is decreasing over the chart which suggests the weakness of the current bullish phase and MACD is stranded near zero, as per the technical indicators.
Technical Levels-
Resistance level- $2.845 and $3.376
Support level- $1.437 and $2.845
Disclaimer-
The views and opinions stated by the author, or any people named in this article, are for informational purposes only, and they do not establish financial, investment, or other advice. Investing in or trading crypto assets comes with a risk of financial loss.

Andrew is a blockchain developer who developed his interest in cryptocurrencies while pursuing his post-graduation major in blockchain development. He is a keen observer of details and shares his passion for writing, along with coding. His backend knowledge about blockchain helps him give a unique perspective to his writing skills, and a reliable craft at explaining the concepts such as blockchain programming, languages and token minting. He also frequently shares technical details and performance indicators of ICOs and IDOs.


