
 Home
Home News
News
- The dYdX token was currently at $3.08 with a decrease of 2.65 during the intraday trading session.
- The 24-hour low of DYDX was $3.08 and the 24-hour high of DYDX was $3.28.
- The current dYdX token price is above 20, 50, 100, and 200-Day EMA.
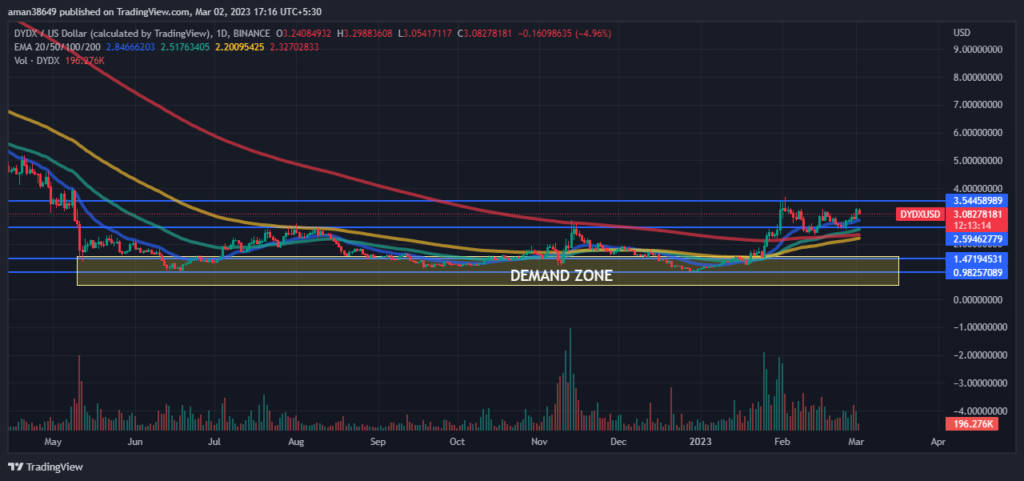
The pair of DYDX/BTC was trading at 0.0001317 BTC with a dip of 1.20% over the intraday trading session. dYdX price analysis suggests that it is currently in an uptrend. 2022 was not a good year as can be seen on the chart that the token was in decline throughout the year. This indicates that the sellers dominated the token for the whole year.

Whenever bulls tried to push the token upwards sellers took back the market and pushed the token downwards. After May 2022 sellers completely took over the market and pushed the token below its primary resistance and forced it to make its new 52-week low. Because of the seller’s pressure, the token was trading near its primary support until the end of the year.

After the start of 2023, the token again began moving upwards breaking its primary support and resistance on its way to reaching its secondary resistance. Soon after the token broke its secondary resistance sellers pushed back the token downwards making the breakout a false breakout. But after the appearance of the morning star chart pattern over the daily trading chart the token again started moving upwards.
The volume of the coin has decreased by 13.97% in the last 24 hours. The decrease in volume indicates that the number of sellers has increased. This shows that sellers are trying their best and there is a relationship between volume and the price of DYDX, which represents strength in the current bearish phase. This indicates that heavy selling is happening in the market.
The technical analysis of dYdX
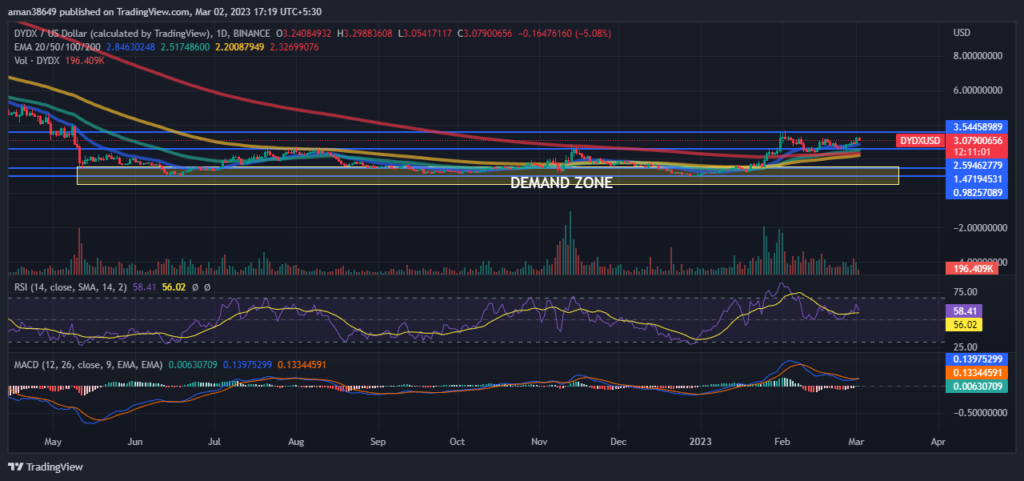
RSI is decreasing in the overbought zone and is showing signs of a negative crossover which indicates that the sellers are coming in the majority and pushing DYDX downwards. This suggests the strength of the current bearish trend. The current value of RSI is 58.41 which is above the average RSI value of 56.03.
The MACD and the signal line are decreasing but not showing any definitive crossover which can support the RSI claims. Investors need to watch every move over the charts during the day’s trading session.
Conclusion
dYdX price analysis suggests that the token is in an uptrend. After My 2022 the token was trading near its primary support till the end of the year because of the seller’s pressure in the market. But after the start of 2023, the token started rising but after reaching its secondary resistance the token was in decline. The decrease in volume shows the lack of confidence in traders. RSI is giving a negative crossover which shows strength in a bearish trend but MACD is not giving any definitive crossover, as per the technical indicators.
Technical Levels-
Resistance level- $2.594 and $3.544
Support level- $1.471 and $0.982
Disclaimer-
The views and opinions stated by the author, or any people named in this article, are for informational purposes only, and they do not establish financial, investment, or other advice. Investing in or trading crypto assets comes with a risk of financial loss.

Nancy J. Allen is a crypto enthusiast, with a major in macroeconomics and minor in business statistics. She believes that cryptocurrencies inspire people to be their own banks, and step aside from traditional monetary exchange systems. She is also intrigued by blockchain technology and its functioning. She frequently researches, and posts content on the top altcoins, their theoretical working principles and technical price predictions.


