
 Home
Home News
News

- The Trust Wallet Token was currently at $1.25, decreasing 3.82% during the intraday trading session.
- The 24-hour low of TWT was $1.24 and the 24-hour high of TWT was $1.31.
- The current Trust Wallet Token token price is below 20, 50, 100, and 200-Day EMA.
The pair of TWT/BTC was trading at 0.00005583 BTC with a rise of 0.60% over the intraday trading session. Trust Wallet Token’s price analysis suggests that it is currently in a downtrend. 2022 can be said to be a stable year for the token as can be seen over the daily trading chart the token was consolidating between its primary support and resistance .

After the appearance of a big bullish marubozu candlestick over the daily chart the token broke its primary and secondary resistance and kept the token above the secondary resistance till Mid Dec 2022. After that sellers took back the market from buyers and pushed the token below primary resistance near the end of the year.

After the start of 2023, the token was increasing, and with the support of bulls the token broke its secondary resistance but soon after the breakout sellers became active in the market which pushed the token below primary resistance. If sellers push themselves then the token may reach its primary support which can put the token in critical condition.
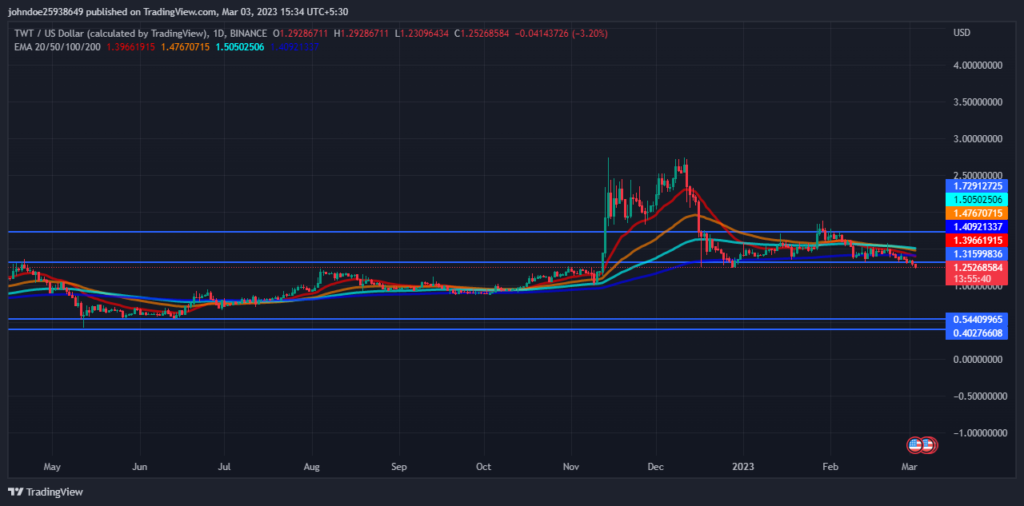
The volume of the coin has increased by 18.85% in the last 24 hours. The increase in volume indicates that the number of buyers has increased. This shows that buyers are trying their best and there is no relationship between volume and the price of TWT, which represents a weakness in the current bearish phase and a possible reversal.
The technical analysis of Trust Wallet Token
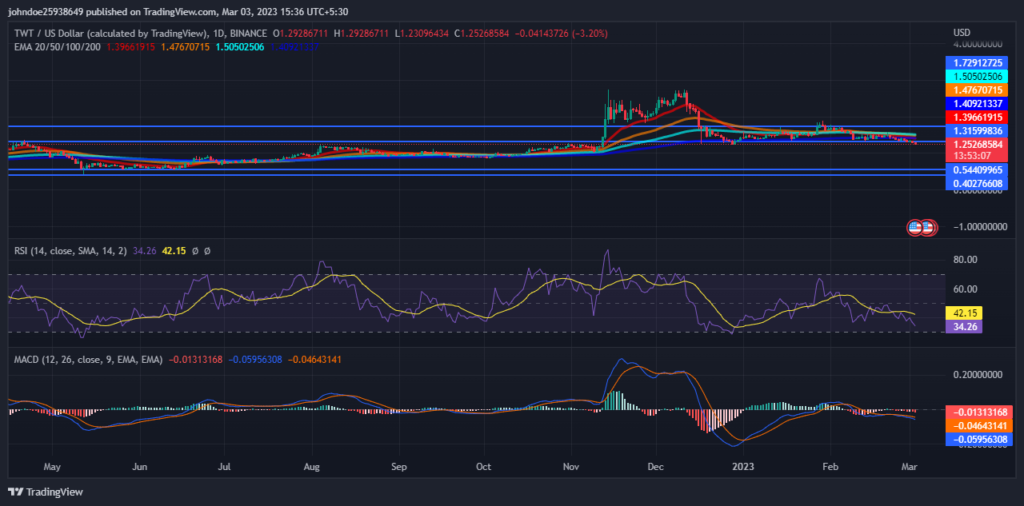
RSI is decreasing in the oversold zone and is showing signs of a negative crossover which indicates that the sellers are coming in the majority and pushing TWT downwards. This suggests the strength of the current bearish trend. The current value of RSI is 34.26 which is below the average RSI value of 42.15.
The MACD and the signal line are decreasing and showing a negative crossover over the daily chart which supports the RSI claims. Investors need to watch every move over the charts during the day’s trading session.
Conclusion
Trust Wallet Token price analysis suggests that it is currently in a bearish phase. 2022 was a stable year for the token and increased throughout the year. The increase in volume shows the positive market sentiment towards the token. RSI and MACD both are decreasing and showing negative crossover on the daily chart which shows strength in the current bearish trend, as per the technical indicators.
Technical Levels-
Resistance level- $1.315 and $1.729
Support level- $0.544 and $0.4027
Disclaimer-
The views and opinions stated by the author, or any people named in this article, are for informational purposes only, and they do not establish financial, investment, or other advice. Investing in or trading crypto assets comes with a risk of financial loss

Nancy J. Allen is a crypto enthusiast, with a major in macroeconomics and minor in business statistics. She believes that cryptocurrencies inspire people to be their own banks, and step aside from traditional monetary exchange systems. She is also intrigued by blockchain technology and its functioning. She frequently researches, and posts content on the top altcoins, their theoretical working principles and technical price predictions.


