
 Home
Home News
News
- 1 SOFI stock gains cheerful cues amid the corrective moves.
- 2 Bulls revived the muscles in the last session, pulled up by 4.15%
SOFI Technologies is an American online personal finance company known for providing financial loans. The stock has faced headwinds in the last 15 days, corrected over 20% from the top. Recently, SOFI stock tried to escape the neckline of resistance near $8.00 but eventually retracted. Notably, the stock price slipped below 200 days EMA which was an immediate hurdle. In the last session, bulls sustained above 20 EMA, conveying that it will soon retest the previous swing of $8.00.

SOFI stock price was traded at $6.72 during yesterday’s market session with an up move of 4.19%. The trading volume also noted 25.45 Million suggesting an increase in the investors’ activities.

However, the price action signals a pullback from the current levels. Last month, the company reported its earnings report for Q4 2022, which performed better than expected, with stock jumps creating a gap that resulted in a correction over the top.
The recent quarterly earnings showed an increase in income by 46% and revenue by 4%. At the same time, EBITDA growth of 257% (YoY) showed healthy financials for the company.
SOFI Technical Analysis on a daily timeframe
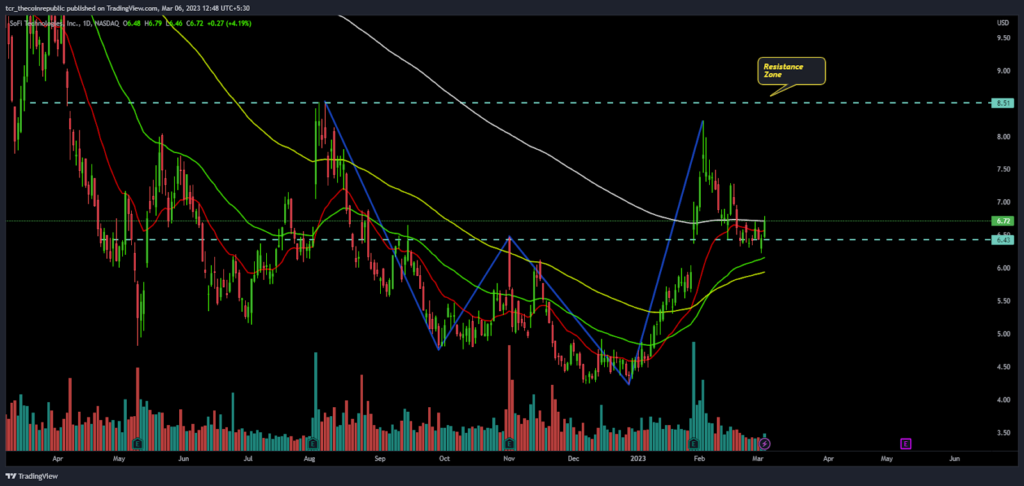
SOFI stock on daily charts showcased a traditional W pattern, where bulls stumble to break the neckline of $8.00 and enlist a fresh breakout. SOFI share price bounced back from the lower Bollinger band and formed a reversal pattern. As per Fib levels, the stock price tested 78.6% and returned to 50%. Now, bulls energize again and stare to attain previous swings of $8.00. The immediate hurdle is $6.90, where 61.8% of Fib levels exist; if surpassed, the next hurdle will be $7.60.
Traditional Indicators on SOFI share
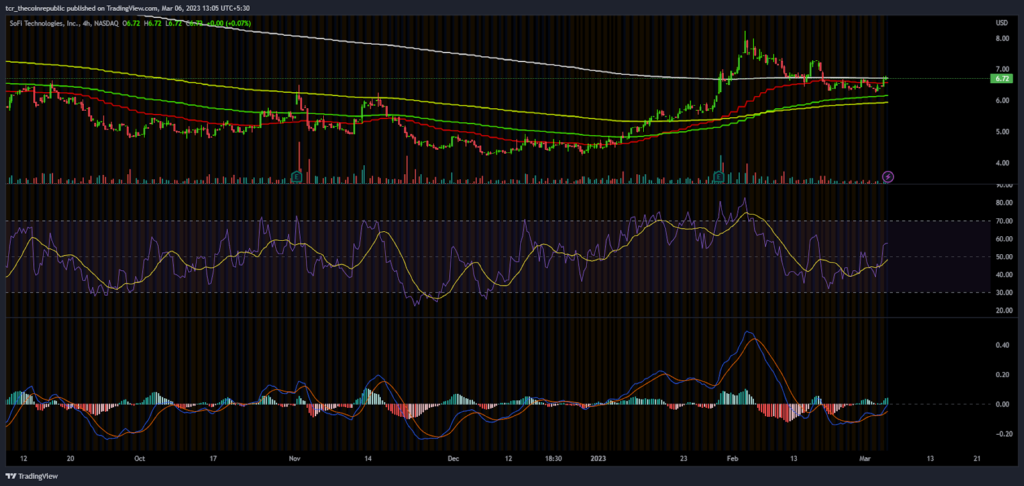
SOFi stock on short-term charts replicates a halt on selling activity, and buyers have now accumulated stock price from its lower trendline support nearing 50 days EMA. From the last week, SOFI stock has formed lower highs and lows and now consolidates in a narrow range. If bulls break the range upwards above 200 days EMA, a fast and sharp move toward $7.00 can be seen.
The RSI of stock is at 58 and reverted above the neutral region from the selling region indicating a positive outlook for the near sessions.
During yesterday’s session, the traditional MACD indicator was observed with a bullish crossover, and ascending green bars were projected on a histogram, suggesting that the buyers are entering now.
Support Levels: $6.00 and $5.40
Resistance Levels:$7.00 and $8.20
Conclusion
SOFI stock completed its correction cycle by filling the gap and is ready to blow the heat in the next sessions. Various analysts gave ratings and maintain bullish cues on the stock.
Disclaimer
The views and opinions stated by the author, or any people named in this article, are for informational purposes only, and they do not establish financial, investment, or other advice. Investing in or trading crypto assets comes with a risk of financial loss.

Andrew is a blockchain developer who developed his interest in cryptocurrencies while pursuing his post-graduation major in blockchain development. He is a keen observer of details and shares his passion for writing, along with coding. His backend knowledge about blockchain helps him give a unique perspective to his writing skills, and a reliable craft at explaining the concepts such as blockchain programming, languages and token minting. He also frequently shares technical details and performance indicators of ICOs and IDOs.


