
 Home
Home News
News

- ATOM price is taking support from a crucial support level
- ATOM price is giving a bullish candlestick pattern
ATOM price after trading crossing above the 200 MA is taking support from it. After the ATOM price broke the downtrend with strong momentum and made a bullish move of 50 percent and after taking a correction of 11% the ATOM price again made a bullish trend of 30% although as of now the price is taking a correction of 30% although currently, the price is taking support from the 100 MA while the 200 MA is trading just above it.

ATOM price taking support from the 200 EMA ( Daily Timeframe )
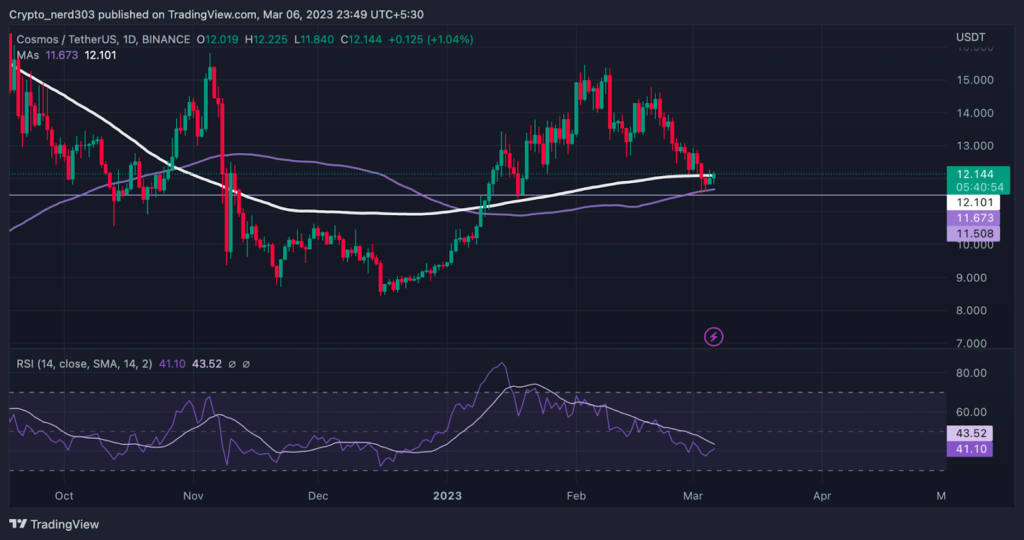
The overall market sentiment is currently trading at the neutral level of around 47 points in the greed and fear index provided by the Alternative (dot) me site which measures the market sentiments from different sources. The meter in greed and fear is seeing a sudden decline of 3 – 4 points since the last week. The bear is currently overwhelming the market by a slight percentage although the bulls are trying to win back aggressively according to the site Coinglass which provides cryptocurrency exchange information.

Technical Analysis ( 1 Day Timeframe )
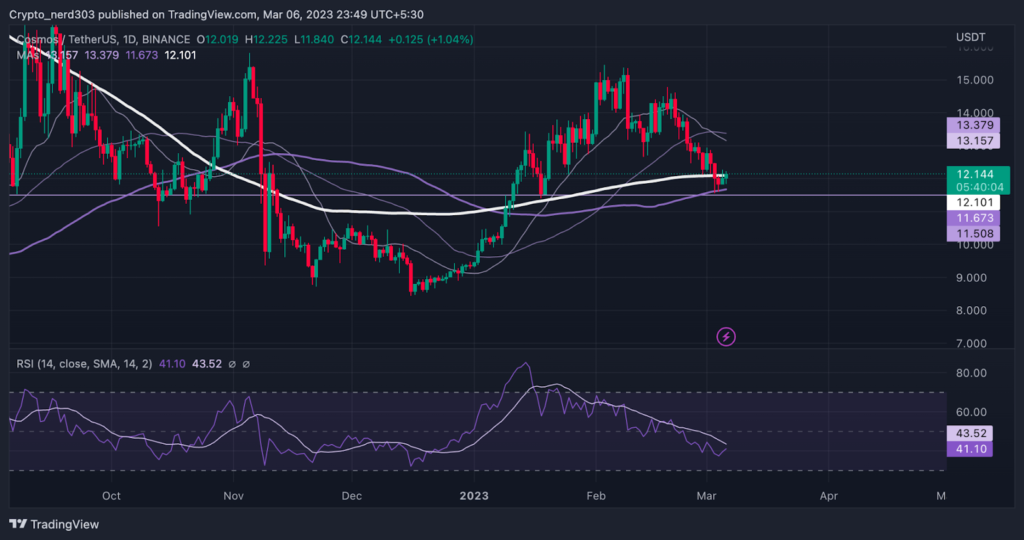
After the 20 MA gave a golden crossover after intercepting the 200 MA and the other major key averages giving a bullish rally of 60% while although after taking a correction of 23% the ATOM price is currently taking support from the price of $12.101 while its next resistance level is around 50 MA mear the price $13.157 while its next resistance is at the next high around $15.000.
The RSI line is currently trading on a downtrend while taking resistance from the 14 SMA. The RSI line is currently trading at 41.10 points while the 14 SMA is trading at 43.52 point providing resistance to it. The RSI curve at the oversold levels is suggesting that might soon make a reversal from its current level.
Conclusion
ATOM’s price is currently after taking a bearish correction from its resistance level it is taking support from the 100 EMA around the level of $12.101 while the candlesticks are making a bullish pattern of two candlesticks the piercing pattern. After taking support from the 100 EMA the second candlestick is crossing above the 200 EMA. If the price crosses above these crucial levels with a strong bullish candle and strong momentum.
Technical levels –
Support – $12.101
Resistance – $13.157 and $15.000.
Disclaimer
The views and opinions stated by the author, or any people named in this article, are for informational purposes only, and they do not establish financial, investment, or other advice. Investing in or trading crypto assets comes with a risk of financial loss.

Nancy J. Allen is a crypto enthusiast, with a major in macroeconomics and minor in business statistics. She believes that cryptocurrencies inspire people to be their own banks, and step aside from traditional monetary exchange systems. She is also intrigued by blockchain technology and its functioning. She frequently researches, and posts content on the top altcoins, their theoretical working principles and technical price predictions.


