
 Home
Home News
News
- The CRV price trading within a wedge-like triangle pattern on the daily timeframe.
- The CRV price takes support from the base level and important average
The CRV price has been consolidating within a widening wedge for the last few months since mid-February. After consolidating for some time while making choppy moves CRV price made an extremely bullish candle of 19 percent after which the price made a bullish rally of 25% in total giving an exceedingly positive uptrend of 42% although after taking resistance from a level of $1.300 price CRV coin made a downturn of 27 percent while it also tried to take support from the $1.000 price making a consolidation the CRV price couldn’t sustain and made another correction of 15 percent.

CRV price trading within a widening wedge triangle pattern (Daily Timeframe)
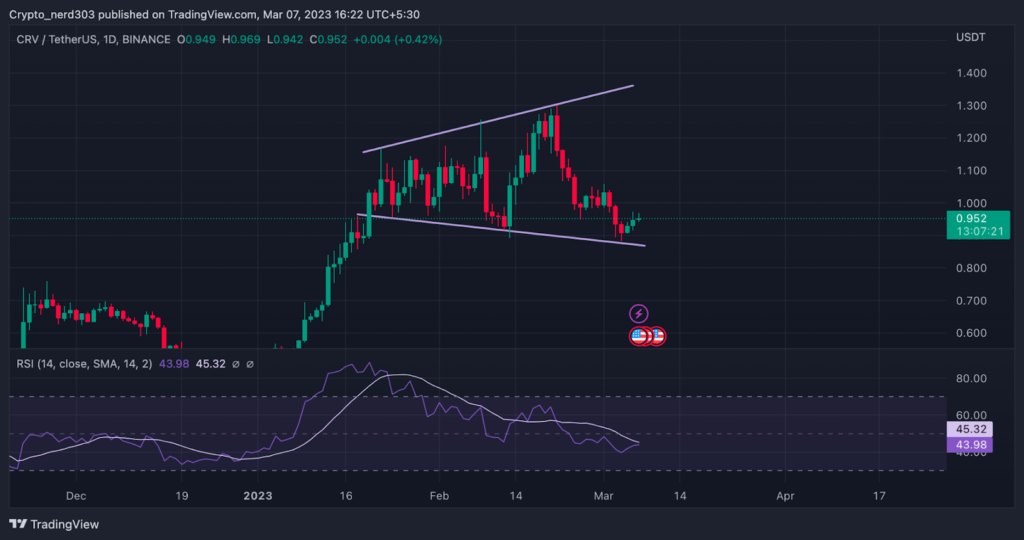
The overall market sentiments are currently trading near the neutral level at 49 points according to the greed and fear index although it is seeing an increase of 2 points from 47 points in the last couple of days according to the site Alternative (dot) me site which measures the market sentiments. While the bears are currently dominating the CRV coin across the major cryptocurrency exchange platforms by 50 – 59% percent according to the Coinglass site.

Technical Analysis ( On 1 Day Timeframe )
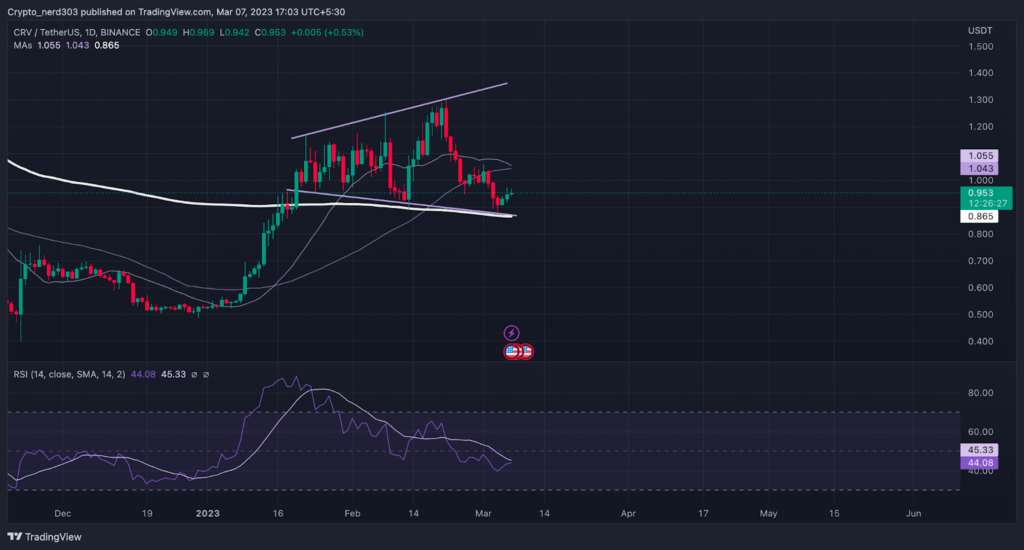
While consolidating within the wedge pattern the CRV price has also been respecting the 200 Moving Average by constantly taking support from it. As of now, the CRV price is taking a pullback from the 200 MA by making a bullish candlestick pattern although the downward curve of 20 MA is suggesting that it can give a bearish crossover.
The RSI line is currently trading near the demand zone while trading in a downtrend. The RSI line is trading at the oversold level of around 44.08 points while taking resistance from the 14 SMA which is trading just above it at around 45.33 points.
Conclusion
Currently, after the bearish correction, CRV is trying to take support from the base level of the triangle wedge pattern around the price of $0.900 while also making a bullish candle stick pattern of three white soldiers often found at the beginning of an up trend by forming three green candles. Although the price might have to face some resistance from the previous consolidation level around the $1.000 price. While it does take a bullish turn with a confirmation chances are that it might give an extremely bullish move of 41%.
Technical levels –
Support – $0.900
Resistance – $1.000 and $1.300
Disclaimer
The views and opinions stated by the author, or any people named in this article, are for informational purposes only, and they do not establish financial, investment, or other advice. Investing in or trading crypto assets comes with a risk of financial loss.
Steve Anderson is an Australian crypto enthusiast. He is a specialist in management and trading for over 5 years. Steve has worked as a crypto trader, he loves learning about decentralisation, understanding the true potential of the blockchain.


