
 Home
Home News
News

- ApeCoin was currently at $3.88 with a decrease of 3.04% during the intraday trading session.
- The 24-hour low of APE was $3.65 and the 24-hour high of APE was $4.00.
- The current ApeCoin token price is below 20, 50, 100, and 200-Day EMA.
The pair of APE/BTC was trading at 0.0001887 BTC with a dip of 3.33% over the intraday trading session.

ApeCoin price prediction suggests that it is currently in a downtrend after getting rejected from its secondary resistance of $6.018. The APE token entered its demand zone because of the heavy selling pressure near the end of the year. After the token touched its secondary resistance of $2.817 it bounced back-breaking its primary support of $3.342 and exiting its demand zone. This indicates that near the end of the year 2022 sellers were given hard competition in the market which can be seen on the daily trading chart.

After the start of 2023, the APE token again started its upward movement which was possible because the buyers started giving support to the token before even starting the year. The APE token broke its primary resistance of $4.523 and even reached its secondary resistance of $6.018 as can be seen on the daily chart but after the formation of the inverted hammer sellers took back the market from buyers which caused the following decline of the token. The inverted hammer candlestick indicates a bullish reversal or short-term downtrend reversal.
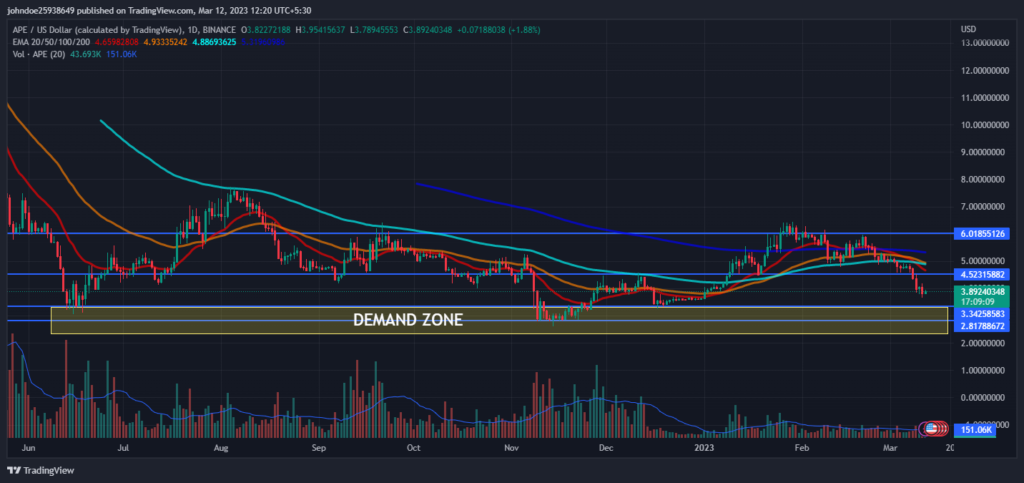
The volume of the coin has decreased by 8.88% in the last 24 hours. The decrease in volume indicates that the number of sellers has increased. This shows that sellers are trying their best and there is a relationship between volume and the price of APE, which represents strength in the current bearish phase.
ApeCoin Price Technical analysis:
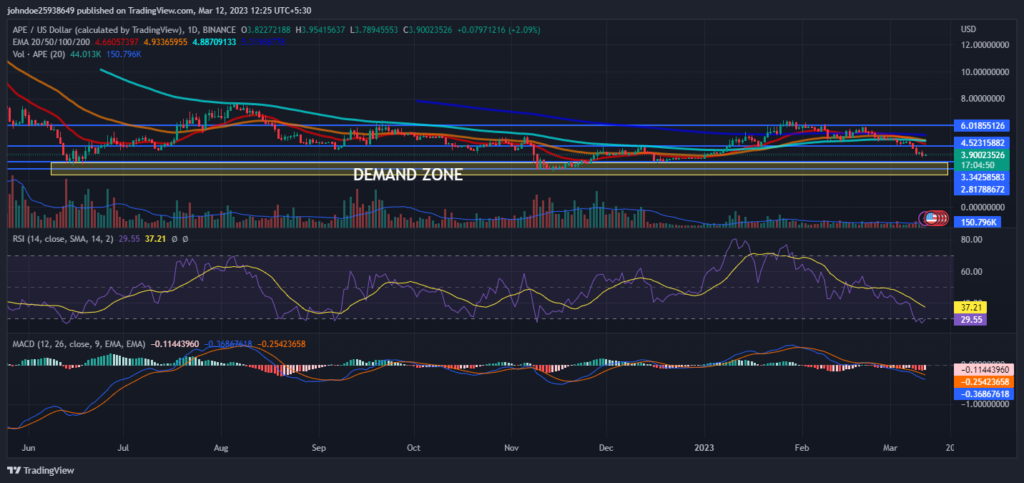
RSI has entered its extreme oversold zone and is shown a negative crossover which indicates that the sellers are coming in the majority and pushing APE downwards. This suggests the strength of the current bearish trend. The current value of RSI is 29.51 which is below the average RSI value of 37.23.
The MACD and the signal line are decreasing but not showing any definitive crossover over the daily chart which can support the RSI claims. Investors need to watch every move over the charts during the day’s trading session.
Conclusion
ApeCoin price prediction suggests that it is currently in a downtrend after getting rejected from its secondary resistance of $6.018. Near the end of the year 2022 sellers were given hard competition in the market which can be seen on the daily trading chart. After the start of 2023, the APE token again started its upward movement which was possible because of the buyers. The decrease in volume suggests a negative market sentiment toward the token.RSI has entered its extreme oversold zone and is shown a negative crossover which shows strength in the current, as per the technical indicators. Traders should take caution before making any trade in the market.
Technical Levels-
Resistance level- $4.523 and $6.018
Support level- $3.342 and $2.817
Disclaimer-
The views and opinions stated by the author, or any people named in this article, are for informational purposes only, and they do not establish financial, investment, or other advice. Investing in or trading crypto assets comes with a risk of financial loss.
Steve Anderson is an Australian crypto enthusiast. He is a specialist in management and trading for over 5 years. Steve has worked as a crypto trader, he loves learning about decentralisation, understanding the true potential of the blockchain.


