
 Home
Home News
News

- 1 BCH price rally faced rejection at primary resistance.
- 2 The price rally is due to the rise in BTC price over the past few days.
- 3 BCH price rose for five trading sessions.
BCH price rallied for five continuous trading sessions, due to its positive relation with BTC, which was highly volatile attributing to the Silicon Valley Bank meltdown. The rally in BCH price is anticipated to be due to the US Department of Treasury, Federal Reserve, and Federal Deposit Insurance Corporation (FDIC) to protect the victims of failed SVB.

BCH slipped below $110, after SVB collapsed on March 11. Post-declaration of Federal Regulators taking over the operations of SVB, BCH price reclaimed the broken price level, and formed a rally. In addition, the count of daily active addresses transacting has spiked by 100%. BCH price may witness a growth in buying momentum, as the active addresses count increases, which can eventually lead to another higher high in BCH price.

Monoscopic View
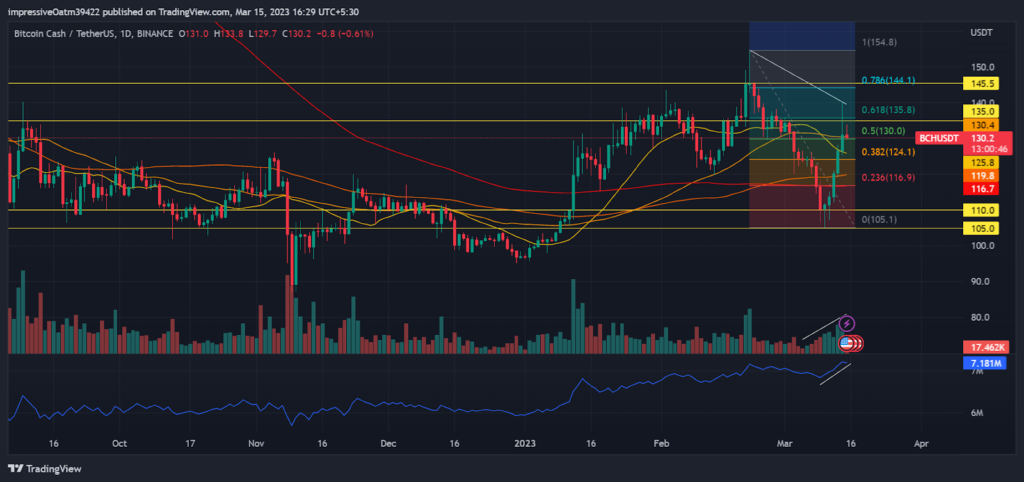
BCH price was rejected near $135.0, after forming a lower high in price action. The price took support near $110.00, and began to rally breaching all levels of retracement, with $155.00 as target. BCH price was unable to break out of the fifth level, and fell temporarily. The volume shows increasing participation by the investors in the market. The EMA ribbon formed a bullish crossover after which BCH price formed a rally. The spike in OBV suggests current market situations to be in favor of BCH price.
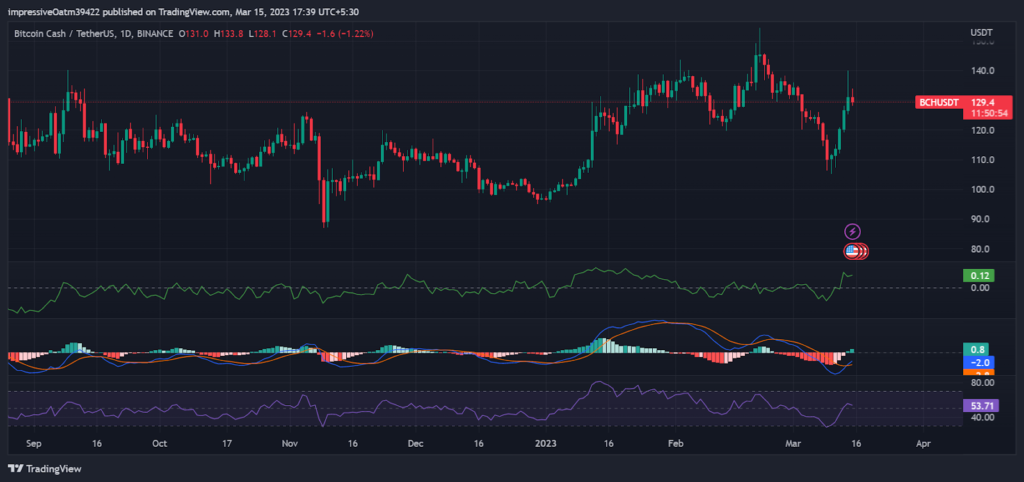
The CMF spiked to the positive zone to reflect bullish influence in BCH price action. The MACD formed a positive cross and started to record buyer bars, after nullifying selling pressure. The RSI escalates to the upper half to display buyers influencing BCH price movement. The indicators cumulatively suggest bullish signals and rally to form in longer duration.
Microscopic View
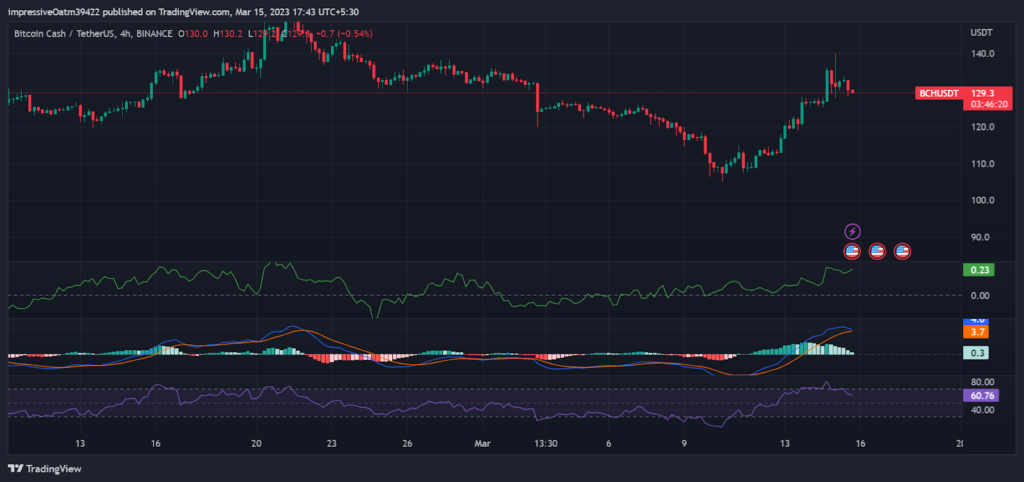
BCH price in the 4 hour timeframe shows a staggered rise, as sellers wish to book profits at higher prices. The CMF shows sideways movement in the zone above the baseline, to mark the bullish influence. The RSI after a short visit to the overbought zone, retraces to 60-range and continues to move under buyer’s influence. The MACD forms a possibility of negative crossover as the lines near a convergence and record descending buyer bars. The indicators suggest BCH price to temporarily face resistance and then form a stronger high run.
Conclusion
BCH price faces rejection near the resistance of $135.00. The indicators give out signals of temporary retracement and can form a bull run in the long term. In relation to BTC price action, it can match its price movement, as the lead is preparing for a possible rally. The holders of BCH can trust the support near $110.00.
Technical levels
Support levels: $110.00 and $105.00
Resistance levels: $145.5 and $135.0
Disclaimer
The views and opinions stated by the author, or any people named in this article, are for informational purposes only, and they do not establish financial, investment, or other advice. Investing in or trading crypto assets comes with a risk of financial loss.

Andrew is a blockchain developer who developed his interest in cryptocurrencies while pursuing his post-graduation major in blockchain development. He is a keen observer of details and shares his passion for writing, along with coding. His backend knowledge about blockchain helps him give a unique perspective to his writing skills, and a reliable craft at explaining the concepts such as blockchain programming, languages and token minting. He also frequently shares technical details and performance indicators of ICOs and IDOs.


