
 Home
Home News
News

- Polkadot is currently at $6.62 (press time), with an increase of 5.32% during the intraday trading session.
- The 24-hour low of DOT was $6.27 and the 24-hour high of DOT was $6.70.
- The current Polkadot token price is above 20, 50, 100, and 200-Day EMAs.
The pair of DOT/BTC was trading at $0.0002405 BTC with a dip of 0.42% over the intraday trading session.

Polkadot price analysis suggests that it is currently in an uptrend after the formation of the bullish hammer candlestick-like pattern over the daily trading chart. After the start of 2023, DOT again started moving upward, breaking its primary support and resistance on its way up. But as soon as the token reached its secondary resistance of $7.92 sellers became active, pushing the token below its primary support. After that, the DOT token broke its primary support of $6.06 and the buyers became hyperactive in the market as can be seen on the chart. The trading volume rose above the average trading volume suggesting that there is heavy buying happening in the market.

The formation of a bullish hammer candlestick-like pattern after a downtrend over the daily time frame chart indicates that the DOT token has reached its bottom and is positioned for a trend reversal. It indicates that sellers entered the market, pushing DOT token down, but were later outnumbered by buyers who drove the price up. This might be the cause for the current uptrend that can be seen over the daily chart.
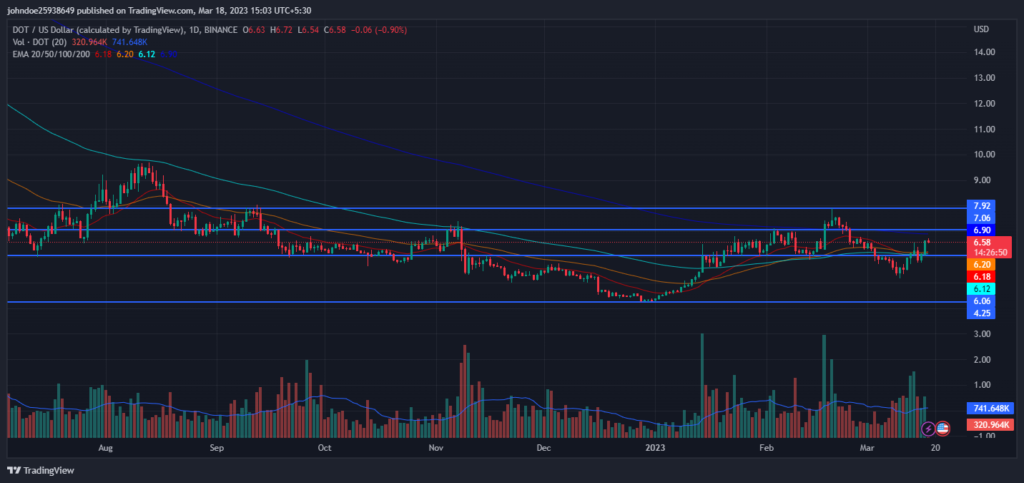
The volume of the coin has increased by 31.71% in the last 24 hours. The increase in volume indicates that the number of buyers has increased.
Polkadot Price Technical analysis:
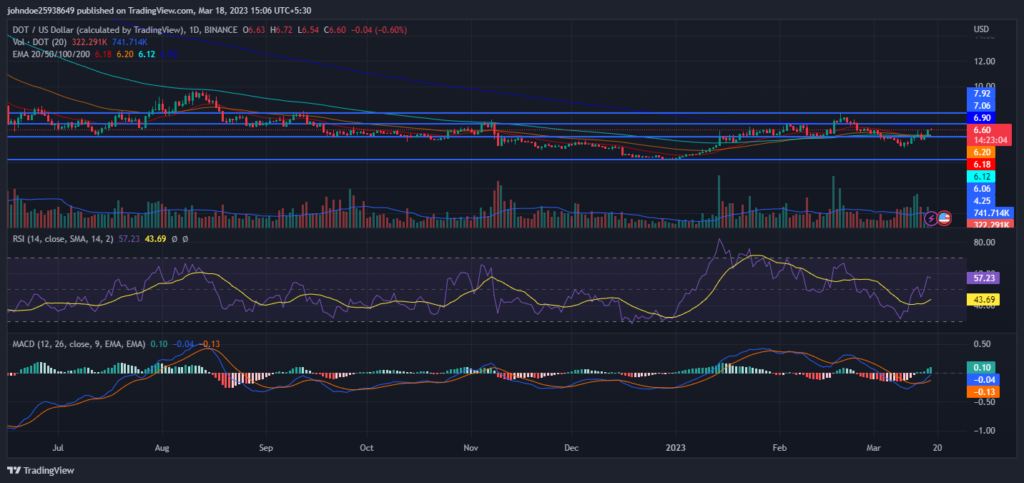
RSI is proceeding toward the overbought zone and displayed a positive crossover which indicates that the buyers are coming in the majority and pushing the price upwards. This suggests the strength of the trend. The current value of RSI is 57.03 which is below the average RSI value of 43.67.
The MACD and the signal line are increasing and showing a bullish crossover over the daily chart which supports the RSI description.
Conclusion
Polkadot price analysis suggests that it is currently in an uptrend after the formation of the bullish hammer candlestick pattern over the daily trading chart. From the start of 2023, the DOT token is seeking stability in the market with the help of buyers. The increase in volume indicates positive market sentiment towards the DOT token. RSI and MACD both are increasing and have shown a positive crossover over the daily trading chart which indicates strength in the current uptrend, as per the technical indicators.
Technical Levels-
Resistance level- $7.06 and $7.92
Support level- $6.06 and $4.25
Disclaimer-
The views and opinions stated by the author, or any people named in this article, are for informational purposes only, and they do not establish financial, investment, or other advice. Investing in or trading crypto assets comes with a risk of financial loss.

Nancy J. Allen is a crypto enthusiast, with a major in macroeconomics and minor in business statistics. She believes that cryptocurrencies inspire people to be their own banks, and step aside from traditional monetary exchange systems. She is also intrigued by blockchain technology and its functioning. She frequently researches, and posts content on the top altcoins, their theoretical working principles and technical price predictions.


