
 Home
Home News
News

- Cardano was currently at $0.3443 with a decrease of 2.62% during the intraday trading session.
- The 24-hour low of ADA was $0.337 and the 24-hour high of ADA was $0.3566.
- The current Cardano token price is below 20, 50, 100, and 200-Day EMA.
The pair of ADA/BTC was trading at 0.00001263 BTC with a dip of 2.20% over the intraday trading session.

Cardano price prediction suggests that it is in an uptrend after breaching its primary support of $0.332. After the start of 2023, the token again started moving upwards from its 52-week low. With the support of buyers, the token broke its primary support of $0.332 as can be observed over the daily trading chart. But after reaching its primary resistance of $0.420 the sellers again started actively participating in the market which resulted in the previous downtrend.

The formation of the bullish hammer candlestick pattern after a downtrend over the daily time frame chart might be the cause of the current bullish reversal as can be seen on the daily trading chart. The hammer candlestick is a bullish trading pattern and it may indicate that the ADA token has reached its bottom and is positioned for trend reversal. Specifically, it indicates that sellers entered the market, pushing the price down, but were later outnumbered by buyers who drove the asset price up.
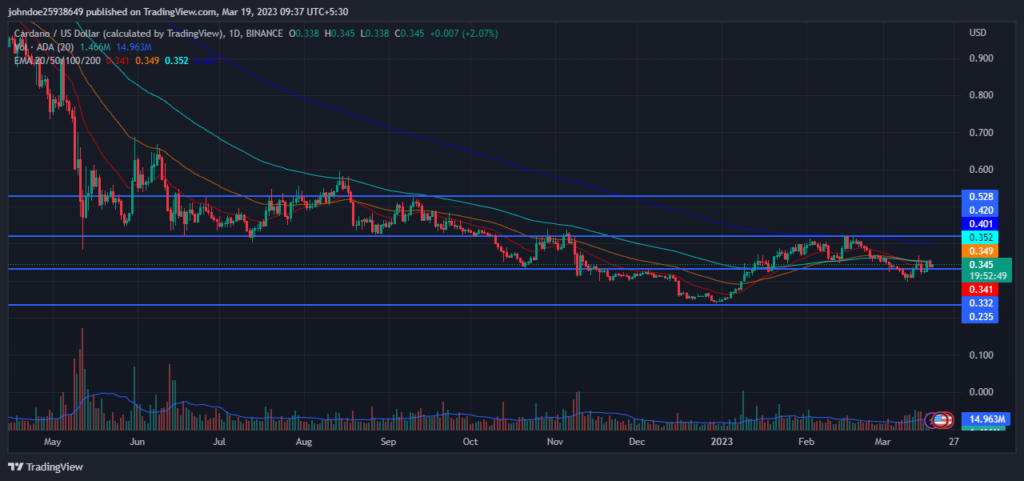
The volume of the coin has decreased by 31.28% in the last 24 hours. The decrease in volume indicates that the number of sellers has increased. This shows that sellers are trying their best and there is a relationship between volume and the price of ADA, which represents a weakness in the bullish phase.
Cardano Price Technical analysis:
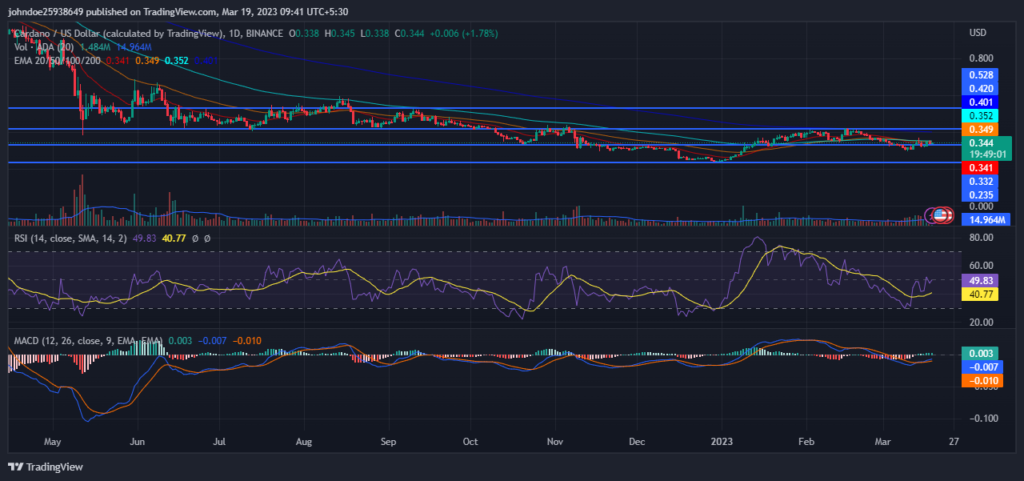
RSI is increasing in the oversold zone and is shown a positive crossover which indicates that the buyers are coming in the majority and pushing ADA upwards. This suggests the strength of the current bullish trend. The current value of RSI is 49.83 which is above the average RSI value of 40.77.
The MACD and the signal line are increasing and showing a positive crossover over the daily chart which supports the RSI claims. Investors need to watch every move over the charts during the day’s trading session.
Conclusion
Cardano price prediction suggests that it is in an uptrend after breaching its primary support of $0.332.After the start of 2023, the token again started moving upwards from its 52-week low. The decrease in the trading volume in the last session shows the negative market sentiment towards the ADA token. The RSI and MACD are increasing and are showing a positive crossover on the daily trading chart. This may give opportunities to the long traders to enter the market.
Technical Levels-
Resistance level- $0.420 and $0.528
Support level- $0.332 and $0.235
Disclaimer-
The views and opinions stated by the author, or any people named in this article, are for informational purposes only, and they do not establish financial, investment, or other advice. Investing in or trading crypto assets comes with a risk of financial loss.

Nancy J. Allen is a crypto enthusiast, with a major in macroeconomics and minor in business statistics. She believes that cryptocurrencies inspire people to be their own banks, and step aside from traditional monetary exchange systems. She is also intrigued by blockchain technology and its functioning. She frequently researches, and posts content on the top altcoins, their theoretical working principles and technical price predictions.


