
 Home
Home News
News
- Solana was currently at $21.84 with a decrease of 1.99% during the intraday trading session.
- The 24-hour low of SOL was $21.14 and the 24-hour high of SOL was $22.28.
- The current Solana token price is between 100, and 200-Day EMA.
The pair of SOL/BTC was trading at 0.0007975 BTC with a dip of 1.25% over the intraday trading session.

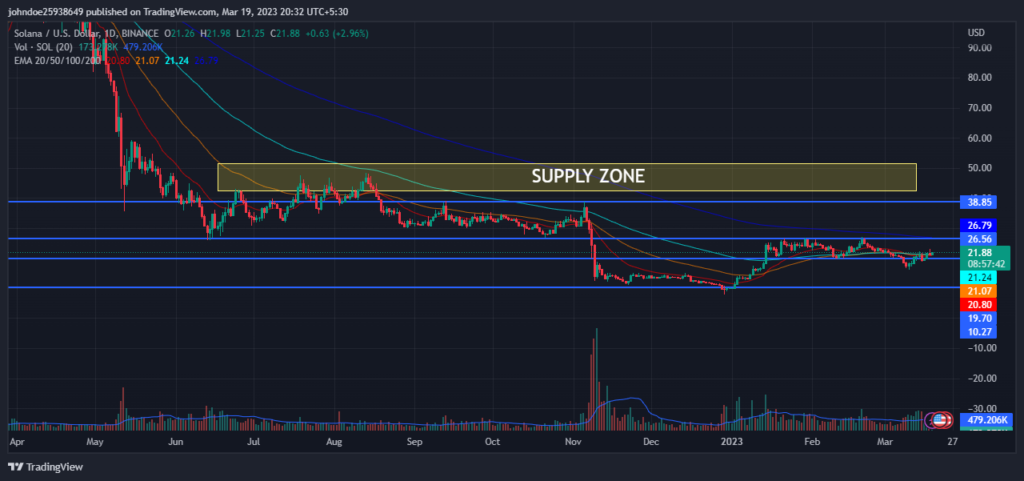
Solana price prediction suggests that it is currently in an uptrend after testing its primary support of $19.70. After the start of 2023, the SOL token is trying to seek stability in the market after experiencing a bear market in 2022. From the beginning of the year, the SOL token started its upward movement with the help of buyers breaking its primary support. But after reaching its primary resistance of $26.56 the SOL token began consolidating between its primary support and resistance until a spinning top candlestick pattern appeared near the primary support.

After this, the SOL token was in a downtrend as the sellers took over the market. This cause the SOL token to fall below its primary support. But the formation of a bullish hammer candlestick pattern after a downtrend might be the cause of the current bullish trend as can be seen over the daily time frame chart. The seller’s attempts for trend reversal seem to disturb the buyers. If the buyers lose their grip over the SOL crypto the price might drop up to the primary support of $17.17 and it could also reach up to the secondary support of $9.58.
The volume of the coin has decreased by 40.22% in the last 24 hours. The decrease in volume indicates that the sort-selling in the market has increased. This shows that sellers are trying their best and there is a relationship between volume and the price of SOL, which represents a weakness in the bullish phase.
Solana Price Technical analysis:
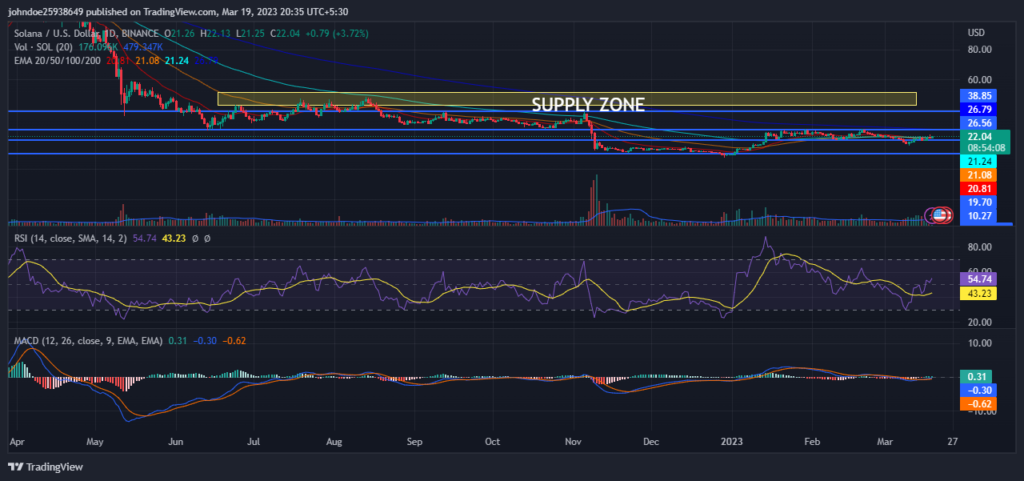
RSI is increasing in the overbought zone and is shown a positive crossover which indicates that the buyers are coming in the majority and pushing SOL upwards. This suggests the strength of the current bullish trend. The current value of RSI is 54.70 which is above the average RSI value of 43.23.
The MACD and the signal line are intersecting but are stranded near zero which doesn’t present any definitive evidence which can support the RSI claims. Investors need to watch every move over the charts during the day’s trading session.
Conclusion
The current market trend for Solana is bullish and the coin is following the uptrend. The decrease in trading volume suggests negative market sentiment towards the SOL token. RSI moving toward neutrality shows that buyers are interested. However, Solana has not gained stability since the start of 2023. Investors have to keep a watch on the SOL and wait for any directional change over the daily price chart.
Technical Levels-
Resistance level- $26.56 and $38.85
Support level- $19.70 and $10.27
Disclaimer-
The views and opinions stated by the author, or any people named in this article, are for informational purposes only, and they do not establish financial, investment, or other advice. Investing in or trading crypto assets comes with a risk of financial loss.

With a background in journalism, Ritika Sharma has worked with many reputed media firms focusing on general news such as politics and crime. She joined The Coin Republic as a reporter for crypto, and found a great passion for cryptocurrency, Web3, NFTs and other digital assets. She spends a lot of time researching and delving deeper into these concepts around the clock, and is a strong advocate for women in STEM.


