
 Home
Home News
News
- SOL coin price had been training in the long term demand zone; it recently failed to sustain, resulting in a breakdown.
- SOL coin price is forming a double top pattern on the daily time frame.
- The pair of SOl/USDT by tradingview is trading at the price level of $0.0007984 with a decrease of -2.45% in the past 24 hours.
SOL coin price is losing strength as the market corrects after a short bullish rally. Recent fall in the price of the coin price led to the breakdown of the demand zone. At press time, SOL coin price is transacting at the price level of $22.49.
SOL Coin Price Forms Negative Price Structure
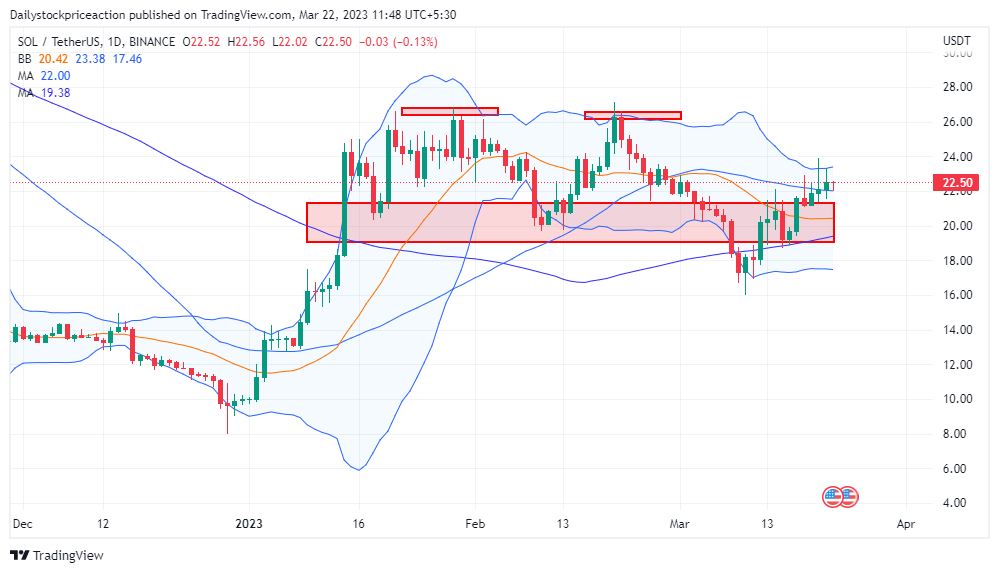
SOL coin price action suggests a bearish momentum in the upcoming trading weeks. As the coin price fell below the demand zone, it was seen forming a strong breakdown candle confirming the bearishness. As of now, SOL coin price is trading below the 50-day moving average. Moving upwards, this MA can be seen acting as a strong supply zone.
AS of now, SOL coin price is transacting at the upper band of the bollinger band indicator as the coin price retests the breakdown zone. If SOL coin price breaks out of the recent breakdown zone, then it can be seen moving upwards or else it can be seen continuing the bearish trend which seems likely. Volumes have increased as the coin price triggered a negative trend. As a result the volatility is bound to increase.
SOL Coin Price Forms a Double Top Pattern
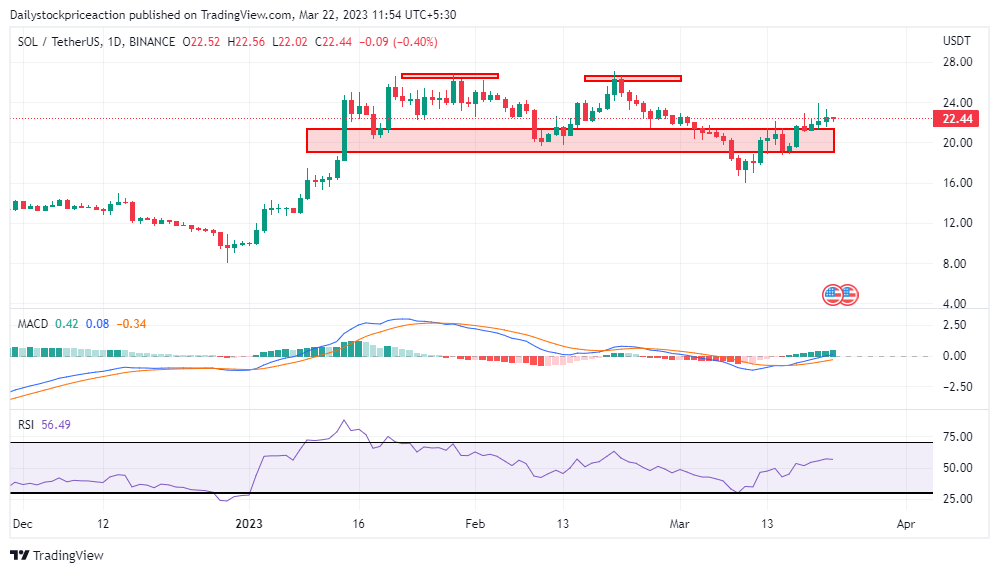
Relative Strength Index is seen rising above the halfway mark of 50. As the coin price rose to retest the breakdown zone, the RSI curve also followed. However, it remains to be seen if the coin price will continue the uptrend and defy the bearish trend or fail to do so and start falling again. If SOL coin price falls again after retesting the supply zone, the RSI curve can be seen falling.
MACD indicator triggered a positive crossover despite a negative breakdown. The blue line crossed the orange line on the upside as it retested the supply zone. If the bulls overpower the bears and continue the uptrend, then the MACD lines can be seen moving apart, supporting the trend.
Conclusion: As per the price movement, SOL coin price has been showing a bearish trend. Technical parameters suggest a bullish trend. As of now, the trend seems to be indecisive and therefore investors should exercise caution and wait for a clear trend.
Support: $19.80 and $17.90
Resistance: $25.60 and $26.90
Disclaimer
The views and opinions stated by the author, or any people named in this article, are for informational ideas only, and they do not establish financial, investment, or other advice. Investing in or trading crypto assets comes with a risk of financial loss.

Nancy J. Allen is a crypto enthusiast, with a major in macroeconomics and minor in business statistics. She believes that cryptocurrencies inspire people to be their own banks, and step aside from traditional monetary exchange systems. She is also intrigued by blockchain technology and its functioning. She frequently researches, and posts content on the top altcoins, their theoretical working principles and technical price predictions.


