
 Home
Home News
News

IOTA price is currently trading under the 200-day EMA under the bearish influence, after trading under the 100-day EMA for the past few months. Although after taking a steep fall of 25 percent in early December around the price of $0.2000 IOTA took support from $0.1400 and regained 43 percent of its value.

IOTA Price Faces Resistance From 200-day EMA (Daily Time frame)
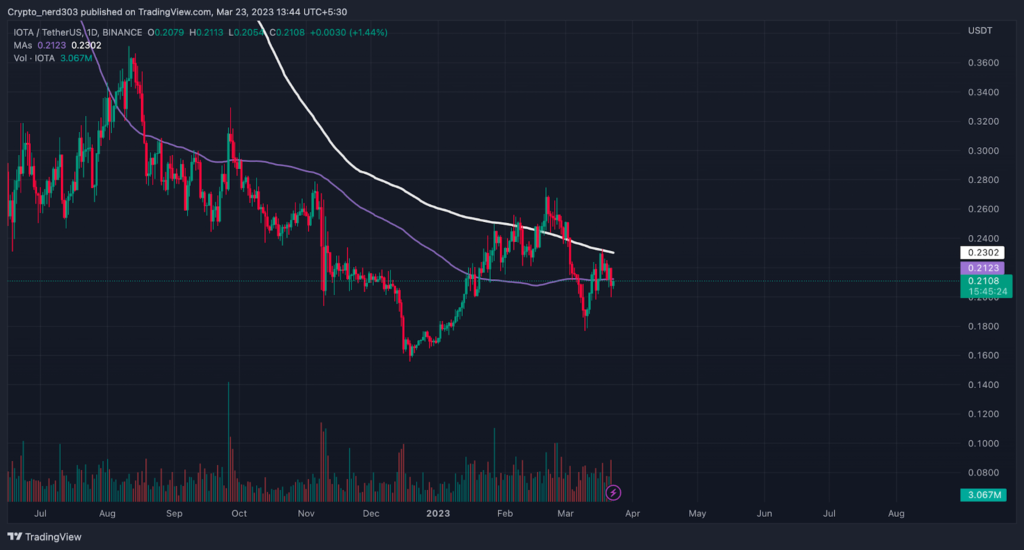
After taking support at $0.1400, IOTA price made a bullish rally of 43 percent. However, the price made a small correction from the 100-day EMA. The buyers supported the price and it broke its long term resistance while gaining another 35 percent. The price did try to break its critical resistance – 200-day EMA – but it couldn’t sustain above it and took a sharp rejection of 35 percent. The overall trend of price action seems to have changed as the price is making a higher-high and higher-low pattern.

On the Greed and Fear Index, the stock is in the Greed zone with 57 points. The index is seeing a slight decline of 3 percent in recent days where the market was trading around 62 points. According to Coinglass, the bulls are currently dominating the price action by 51 to 63 percent.
Technical Analysis (On 1 Day Time frame)
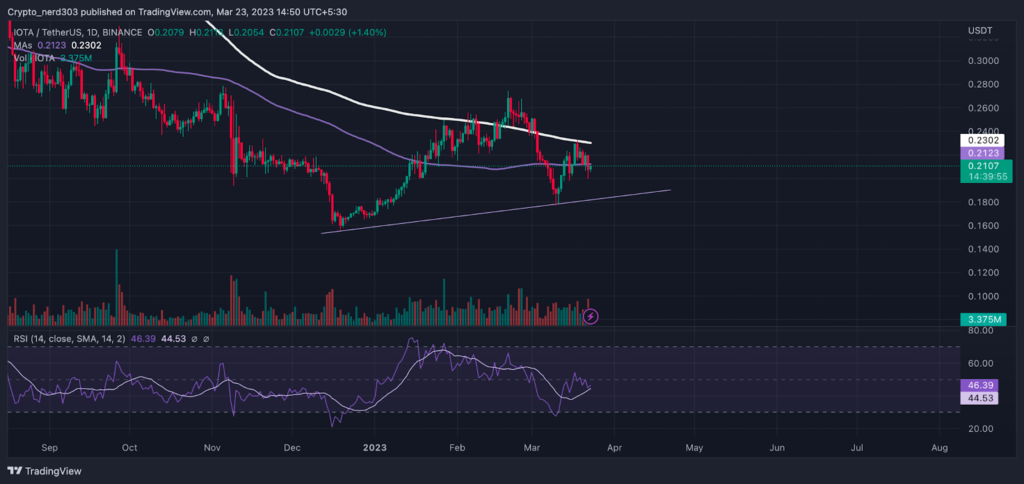
The price is currently facing resistance from the 100-day EMA while it trades below the 200-day EMA. The RSI line is taking resistance from the median line while making a downward curve which suggests that the RSI line might start moving toward the oversold zone. The current RSI value is 46.44 points while the 14 SMA is trading just below it at 44.53 points. The RSI line is following the price action, indicating its strength.
Conclusion
As of now, after taking support at $0.1800 and making a higher-low in its bull trend, the price is taking resistance from the 100 EMA around $0.2300. The making of a downward curve in the price after taking rejection from the barrier is suggesting that the price might take a correction, falling below $0.1900 and giving a downturn of more than 10 percent.
Technical levels –
Support – $0.1900 and $0.1800
Resistance – $0.2123 and $0.2302
Disclaimer
The views and opinions stated by the author, or any people named in this article, are for informational purposes only, and they do not establish financial, investment, or other advice. Investing in or trading crypto assets comes with a risk of financial loss.

Andrew is a blockchain developer who developed his interest in cryptocurrencies while pursuing his post-graduation major in blockchain development. He is a keen observer of details and shares his passion for writing, along with coding. His backend knowledge about blockchain helps him give a unique perspective to his writing skills, and a reliable craft at explaining the concepts such as blockchain programming, languages and token minting. He also frequently shares technical details and performance indicators of ICOs and IDOs.


