
 Home
Home News
News

- 1 XMR price takes resistance from the 200 EMA
- 2 XMR price might take a correction of 12 percent in the upcoming days
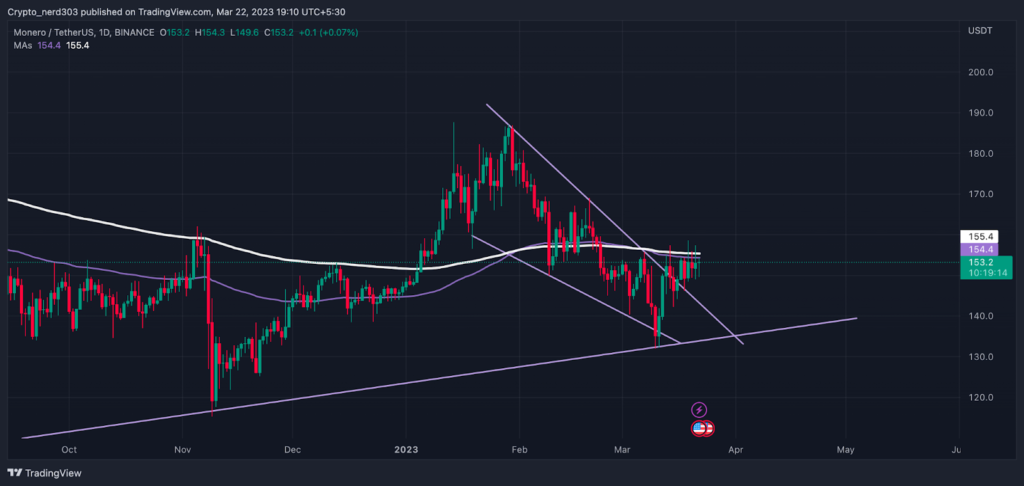
XMR price is currently making a narrow consolidation around its resistance level near the 200-day EMA. As stated in the previous analysis given by our analysts the XMR price after making a brief consolidation the price broke down its consolidation and made a downturn of 8 percent early March while in the second analysis, the price took resistance from the 200-day EMA and 100-day EMA giving a break down of 15 percent.

XMR price has been trending under a descending wedge after failing to sustain above $180.0. After taking rejection at $186.6, XMR token fell by 19 percent while breaking its 200-day EMA support with a strong bearish candle and breaking its previous bull trend by making a lower low. After breaking the support level, XMR price started trading under a bearish trend while moving under a descending wedge-like pattern.

Price Taking Strong Resistance From 200-day EMA (Daily Time frame)
According to Alternative(dot)me, the current score on the Greed and Fear Index is trading around 62 in the Greed zone while seeing a rise of 10 points since last week when the market was trading around the neutral zone of around 50 points. While Coinglass is suggesting that XMR price is currently being dominated by the bears across all the major trading platforms by 50 – 55 percent.
Technical Analysis (1 Day Time frame)
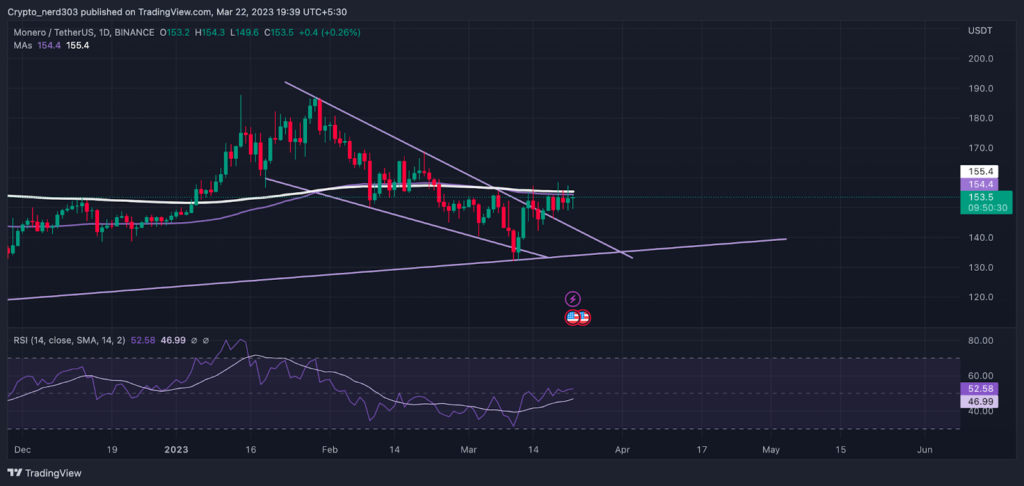
The RSI line is currently trading near the median line while following the price heading beyond the 14 SMA. This suggests that the upcoming price action might enter a bullish trend. The RSI line is trading near 52.48 points while taking support from the 14 SMA which is trading around 46.99 points.
Conclusion
Although after taking support from its major support level of around $132.0, XMR coin broke the wedge-like pattern by giving a strong bullish piercing candlestick pattern followed by an engulfing candle. XMR coin, after breaking the wedge pattern, is making a narrow consolidation while trading just below the 200-day EMA suggesting that the coin is in an accumulation phase. It indicates the possibility that if the buyers support the coin at this level, the price might make a breakout above the 200-day EMA. The same can be a possibility if the price gets rejected by the buyers.
Technical levels –
Support – $148.0
Resistance – $158.0
Disclaimer
The views and opinions stated by the author, or any people named in this article, are for informational purposes only, and they do not establish financial, investment, or other advice. Investing in or trading crypto assets comes with a risk of financial loss.

Andrew is a blockchain developer who developed his interest in cryptocurrencies while pursuing his post-graduation major in blockchain development. He is a keen observer of details and shares his passion for writing, along with coding. His backend knowledge about blockchain helps him give a unique perspective to his writing skills, and a reliable craft at explaining the concepts such as blockchain programming, languages and token minting. He also frequently shares technical details and performance indicators of ICOs and IDOs.


