
 Home
Home News
News

- THETA coin price reaches the supply zone as it manages to sustain the bearish pressure prevailing in the overall market.
- THETA coin price forms a flag and pole pattern on a daily time frame.
- The pair of THETA/BTC is trading at the price level of 0.000369 with an increase of 1.24% in the past 24 hours.
THETA coin price, as per the price action is showing strength despite a bearish trend in the global markets. As of now the THETA coin price is forming a bullish chart pattern as it trades at $1.011.

THETA coin price depicts bullishness
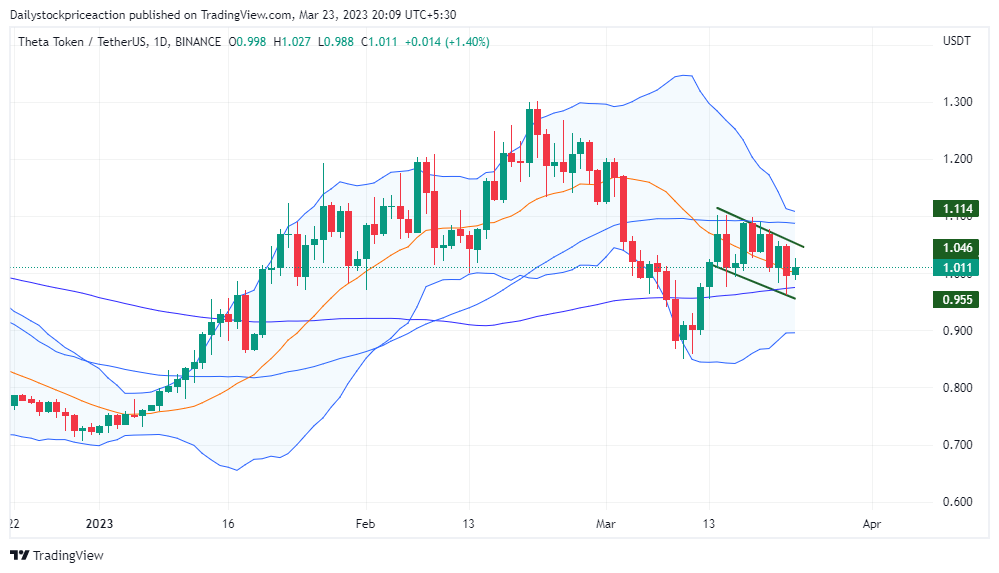
THETA coin price, as it manages to sustain above the long term demand zone resulting in a strong bounce off it. As of now, the THETA coin price is trading above the 100 Moving Average. This comes after the coin price rose to the supply zone resulting in the breakout of this MA. Although the coin price is yet to break the 50 MA, moving upward this MA can be seen acting as a strong supply zone.

THETA coin price is trading at the middle of the bollinger band indicator. THETA coin price has gone through the 15 EMA indicating a short term bullishness. If the THETA coin price manages to break out of the supply zone then it can be breaking the level of $1.305. At present, volumes have been normal as the coin price remains stagnant.
THETA coin price forms a flag and pole pattern
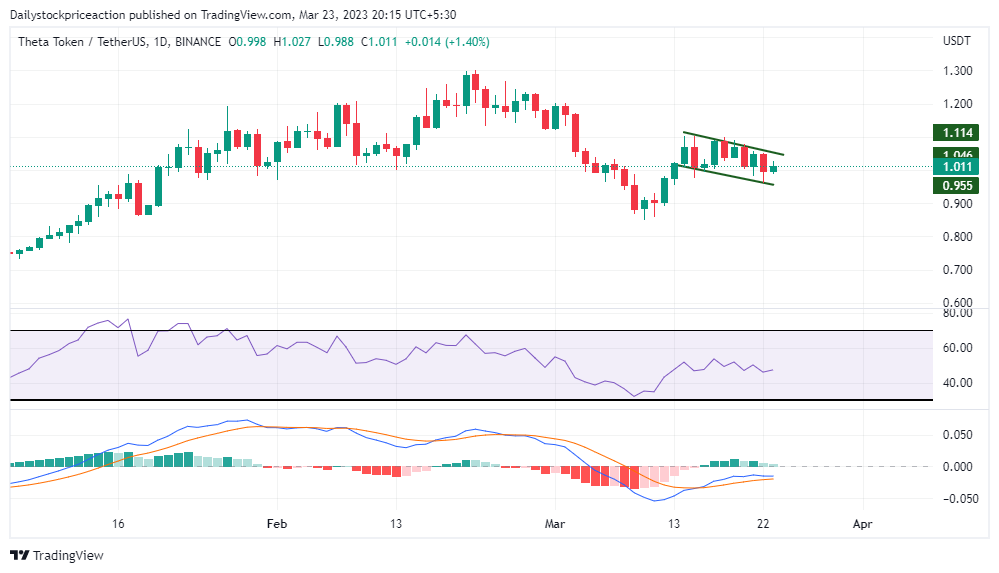
THETA coin price is showing a brief fall as it reaches the supply zone. The ADX curve has been transacting sideways indicating a consolidation in the THETA coin price. If the coin price breaks through the supply zone then the ADX curve can be seen rising higher supporting the pTHETA coin price movement.
THETA coin price is bullish as the MACD indicator suggests.The blue line crossed the orange line on the upside as the MACD indicator triggered positive crossover. This comes after the coin price bounced off the demand zone. THETA coin price if it manages to break out of the supply zone, then the MACD lines can be seen widening supporting the trend.
Conclusion: THETA coin price, as the price action suggests, is bullish on a daily time frame. The technical parameters are neutral as it trades sideways. It remains to see if the coin price will break the supply zone or fail to hold the current level and fall further.
Support: $0.961 and $0.900
Resistance: $1.1 and $1.4
Disclaimer
The views and opinions stated by the author, or any people named in this article, are for informational purposes only, and they do not establish financial, investment, or other advice. Investing in or trading crypto assets comes with a risk of financial loss.

Nancy J. Allen is a crypto enthusiast, with a major in macroeconomics and minor in business statistics. She believes that cryptocurrencies inspire people to be their own banks, and step aside from traditional monetary exchange systems. She is also intrigued by blockchain technology and its functioning. She frequently researches, and posts content on the top altcoins, their theoretical working principles and technical price predictions.


