
 Home
Home News
News

- The current BTT price is $0.000000612 while seeing a decline of -2.69% in the last 24 hours.
- WBTC price is observing an increase of 0.94% in the last 24 hours.
BitTorrent (BTT) is a peer-to-peer file sharing and torrent platform. The BTT price has been trading under the seller’s influence for the past few months while trading below the 50 and 100 EMA. While the bulls did make multiple attempts to take control of the market, the price is currently being overwhelmed by the bears. The price is now making a higher high and higher low pattern suggesting that the price might take a bullish turn in the coming days.

BTT price trading near the demand zone (Daily Timeframe)
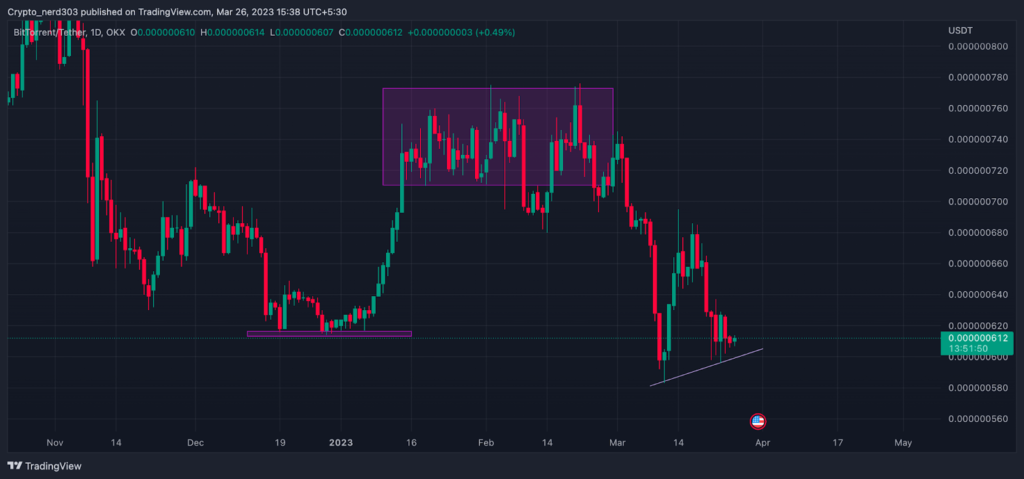
However, the BTT price was not able to cross above the 200 EMA after taking final rejection from the 200 EMA in early March. The BitTorrent price went through its support level and crossed below the 100 EMA while taking a downturn of 21%. After taking support from $0.000000600 and making a bullish hammer pattern, BTT made a bullish engulfing candle. The price made a 17% bullish rally and saw a retest from the 100 EMA.

The overall price action is currently witnessing the bear’s dominance. The market sentiments are currently trading in the greed zone of around 64 points. It saw an increase of 10 points since the last month when the sentiments were trading near the neutral zone of around 54 points. According to Alternative(dot)me, which measures the market sentiments, the buyers are currently dominating the market price action, suggesting that the sellers may soon step in.
Technical Analysis ( 1 Day Timeframe )
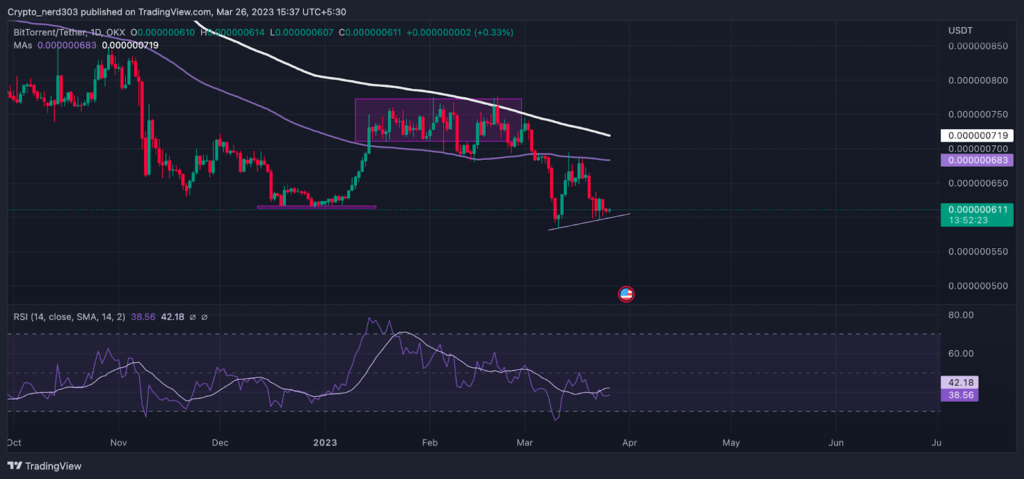
After taking support at $0.000000620, BTT price made a double bottom pattern and a bullish rally while gaining 23% of its value back and crossing above its long-term recent resistance – the 100 EMA. However, even after strong support from the buyers, the BTT price was not able to cross above the 200 EMA and it started consolidating between the two major EMAs.
The Relative Strength Index (RSI) line is currently trading near the undersold zone below the median line. The current RSI value is 38.56 points while taking resistance from the 14 SMA, which is trading around 42.18 points near the median line. The upward curve of the RSI line suggests that it might start moving toward the supply zone.
Technical levels:
Support – $0.000000719
Resistance – $0.000000600
Disclaimer
The views and opinions stated by the author, or any people named in this article, are for informational purposes only, and they do not establish financial, investment, or other advice. Investing in or trading crypto assets comes with a risk of financial loss.

Nancy J. Allen is a crypto enthusiast, with a major in macroeconomics and minor in business statistics. She believes that cryptocurrencies inspire people to be their own banks, and step aside from traditional monetary exchange systems. She is also intrigued by blockchain technology and its functioning. She frequently researches, and posts content on the top altcoins, their theoretical working principles and technical price predictions.


