
 Home
Home News
News

- Fetch.ai is currently trading at $0.3683 (press time) with an increase of 1.25% during the intraday trading session.
- The 24-hour low for FET was $0.3583 and the 24-hour high was $0.3772.
- The current Fetch.ai price is above the 50 and 100-Day EMAs.
The FET/BTC pair was trading at 0.0000133 BTC with a rise of 0.37% over the intraday trading session.

Fetch.ai’s price prediction suggests that it is on a downtrend after testing the primary resistance of $0.488. Since the start of 2023, the FET price was seeking stability after escaping the bear’s claws in 2022. The FET price was on an upward movement, from the start of 2023, breaking its primary and secondary support and primary resistance on its way up.

However, after reaching its secondary resistance of $0.597, sellers became active in the market again and pushed the FET price below its primary resistance. After falling to primary support of $0.354 due to the heavy selling pressure in the market, the FET price began strengthening between the primary support and resistance.
But, the formation of the spinning top candlestick pattern after an uptrend near its primary resistance may be the cause of the current downturn, as can be seen over the daily time frame chart.
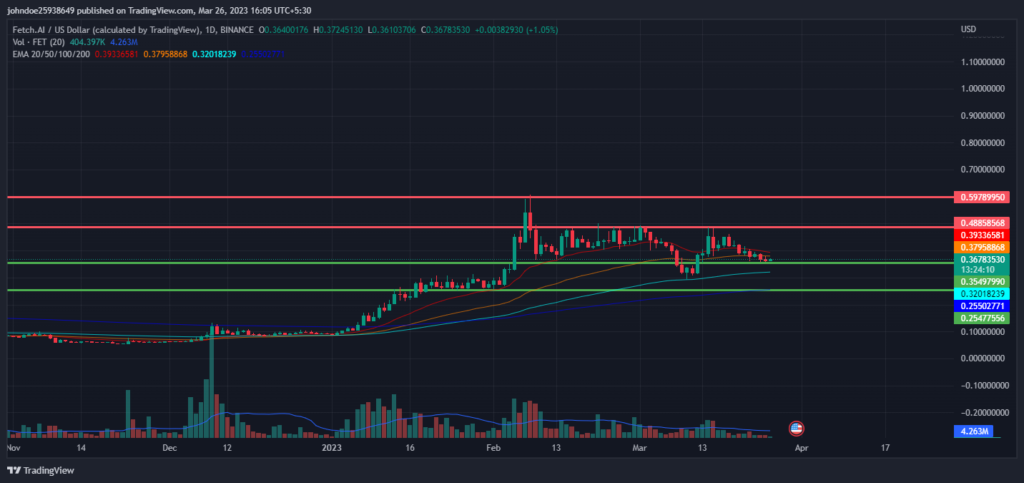
The trading volume of the coin decreased by 10.73% in the last 24 hours, meaning that sort-selling in the market has increased. Sellers are trying their best and there is no relationship between the volume and the price of FET, which shows weakness in the current bearish phase.
Fetch.ai Price Technical Analysis
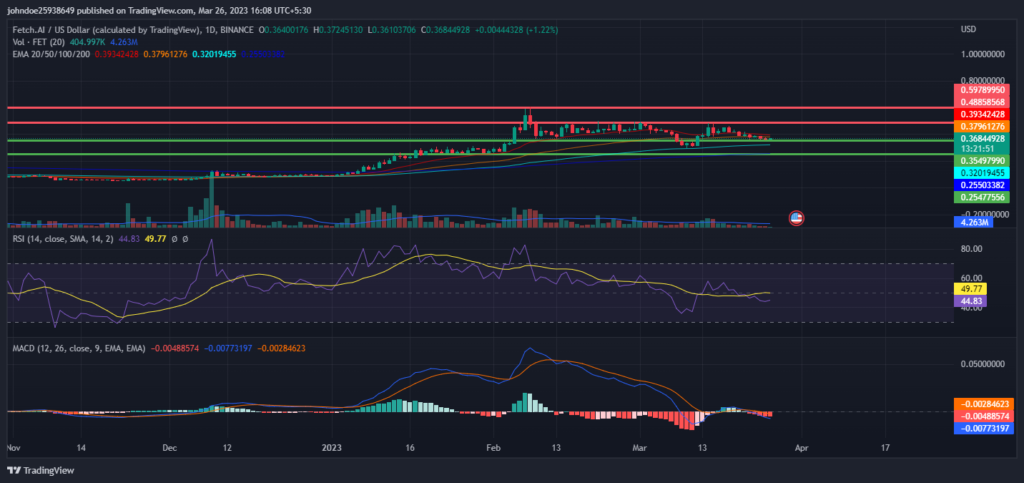
The Relative Strength Index (RSI) is increasing in the oversold zone and might show a positive crossover, wherein the buyers are in the majority and pushing FET upwards. This shows the weakness of the current bearish trend. The current value of RSI is 44.82, which is above the average RSI value of 49.77.
The MACD and the signal line are intersecting but were stranded over the daily chart, which does not provide any evidence supporting the RSI claims.
Conclusion
Fetch.ai’s price prediction suggests that it is currently in a downtrend after testing the primary resistance of $0.488. The decline in trading volume reflects the negative market sentiment for the FET token.
Furthermore, the RSI is increasing in the oversold zone and might show a positive crossover, which indicates weakness in the current bearish phase. Traders are advised to proceed with caution when making trades in the market.
Technical Levels
Resistance level- $0.488 and $0.597
Support level- $0.354 and $0.254
Disclaimer
The views and opinions stated by the author, or any people named in this article, are for informational purposes only, and they do not establish financial, investment, or other advice. Investing in or trading crypto assets comes with a risk of financial loss.

Andrew is a blockchain developer who developed his interest in cryptocurrencies while pursuing his post-graduation major in blockchain development. He is a keen observer of details and shares his passion for writing, along with coding. His backend knowledge about blockchain helps him give a unique perspective to his writing skills, and a reliable craft at explaining the concepts such as blockchain programming, languages and token minting. He also frequently shares technical details and performance indicators of ICOs and IDOs.


