
 Home
Home News
News
- 1 GEVO stock continues to fall, losing momentum sharply.
- 2 The breakdown of previous support spells trouble for buyers.
GEVO stock price is on a perpetual, unwavering downward trend. Over the last week, the stock was under overwhelming selling pressure. Amid bearish market conditions, GEVO seems to have become a favorite among the sellers. Moreover, the Q4 2022 earnings were below estimates – income fell by 89% and revenue by 62%, encouraging the bears to perform a selloff. The lower-lows formation on charts led to a gradual down move towards 52-week lows.
GEVO share broke its previous support near $1.60, an early indication of seller pressures. The rise in volume favors the short-sellers.

Meanwhile, bulls are looking too weak because of low potency, compared to bears. Bulls must sustain above the $2.00 mark to bring the trend back in their favor. With the recent sell-off, long positions are getting trapped, with the sellers getting an advantage by closing below $1.60.
If GEVO breaks its immediate support at $1.30, it could retest $1.00 soon. Moreover, buyers would try to surpass the range quickly if any bounce happens. The band between $1.40- $1.70 was under seller control, and if the price floats within it, bears will try to break it. So, buyers are trying to accumulate and register close above this range.
GEVO Stock Daily Charts Showing Continuing Selloff
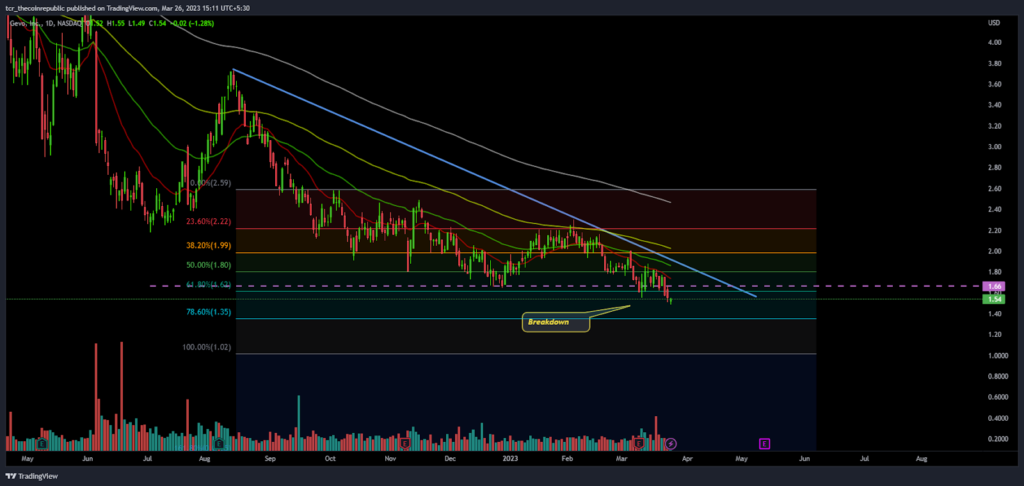
On the daily chart, GEVO stock remains in the hands of bears and those buyers who were long are in trouble. However, price action shows a negative outlook, and per the Fib levels, price is below the 61.8% level. If the price drops further, then $1.38 can be tested, which is the immediate support level. On the other hand, the 61.8% level is at $1.62; above that, GEVO can continue to start the beginning of an up-move.
( NASDAQ: GEVO ) on Short Term Charts
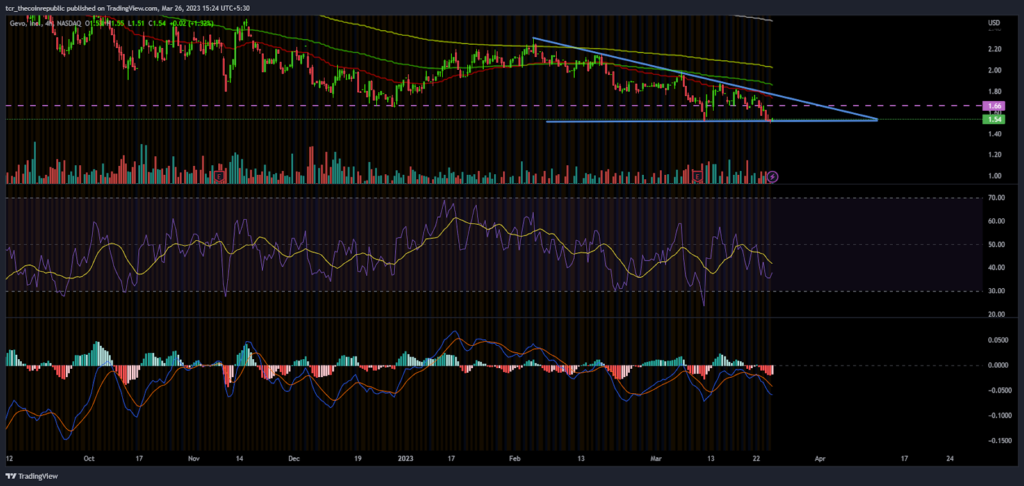
GEVO stock on a 4-hour chart, holds at the previous support mark of $1.50 and forms a double bottom pattern. However, traditional indicators are not indicating a reversal in the near future. The RSI curve slips below the neutral zone, near 40, which shows mild selling pressure. A positive crossover registered when RSI surpasses 55 will lead to a bounce in price.
The MACD indicator persists to form red bars and is still awaiting a crossover, selling pressure is slightly decreasing as buyers hold the price near the support mark and hope for a rebound.
Technical Levels
Support Levels: $1.30 and $1.20
Resistance Levels:$1.80 and $2.00
Conclusion:
GEVO stock price remained in the hands of sellers while the buyers were trying to get back in the fight. This fight has pushed the price near an important mark of $1.50, which has to be looked out for.
Disclaimer
The views and opinions stated by the author, or any people named in this article, are for informational purposes only, and they do not establish financial, investment, or other advice. Investing in or trading crypto assets comes with a risk of financial loss.
.

With a background in journalism, Ritika Sharma has worked with many reputed media firms focusing on general news such as politics and crime. She joined The Coin Republic as a reporter for crypto, and found a great passion for cryptocurrency, Web3, NFTs and other digital assets. She spends a lot of time researching and delving deeper into these concepts around the clock, and is a strong advocate for women in STEM.


