
 Home
Home News
News

- THETA’s price is trading at $1.01 while observing a change in the 24-hour trading volume of -48.16%.
- THETA price is up 0.70% in the last 24 hours.
- It has been showing bearish signs over the last week.
The THETA price is currently making a descending flag and pole pattern while trading under a triangle. It has been favouring the bulls for the last couple of days, but it seems to be taking resistance from the declining trend line. The downtrend shows that the THETA Network has changed trend by making a lower high and lower low. The price is also trading within a declining consolidation range after making a bullish rally making a descending flag and pole pattern.

THETA price trading under a bear trend while consolidating ( Daily Timeframe)
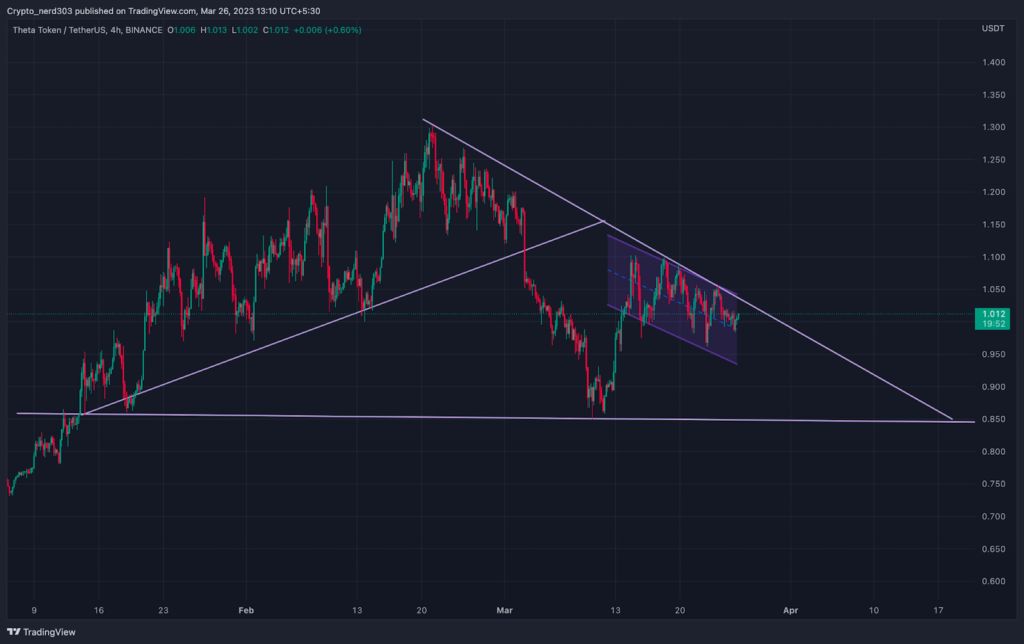
THETA price, after breaking its resistance around $0.800, made a bullish candlestick pattern of three white soldiers. While also giving a higher high and a higher low pattern, it made a breakout through its previous bear trend. Following a bullish move of 21%, it faced resistance at $0.980. Theta Network price made a small correction of 11% and started moving on an uptrend while giving 20 to 30% on each move.

It made its last higher high and made a downturn of 13% following which it crossed below its support line with a strong bearish engulfing candle. Theta Network’s price made a bearish correction and lost 21% of its overall value while making its new lower low. However, after making a double-bottom pattern near its base support line around $0.850, Theta Network made a bullish rally of 30%.
Technical Analysis ( 1 Day Timeframe )
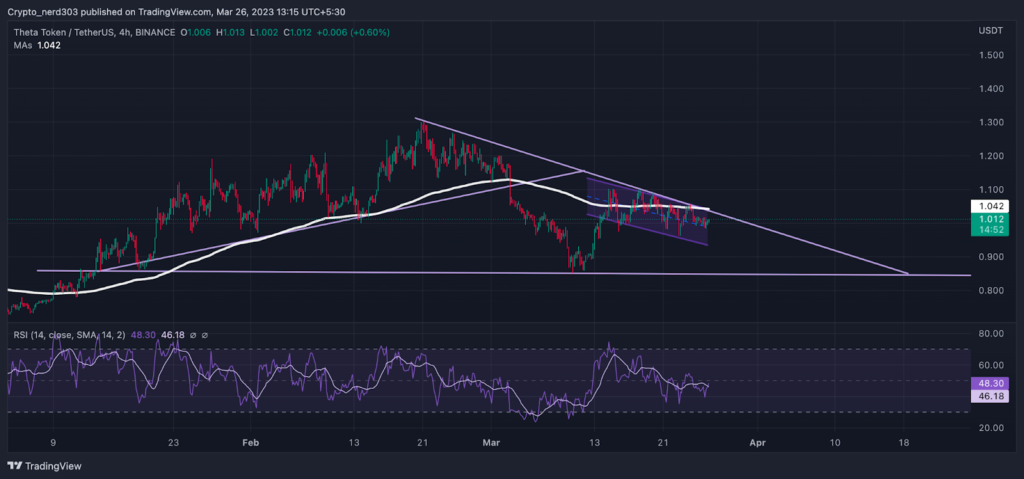
As of now, the Theta Network price is trading under the bear’s influence while trading under a consolidation. It is currently facing resistance from its upper trendline and trading under the 200 EMA. The theta price is also making a pole pattern. The current price action, where the price is trading in a triangle while facing resistance from the 200 EMA, suggests that the price can take a bearish correction of 16% in the near future. The Relative Strength Index (RSI) is currently trading near the median line while facing resistance from the 14 SMA.
Technical levels:
Support – $0.920 and $0.850
Resistance – $1.060
Disclaimer
The views and opinions stated by the author, or any people named in this article, are for informational purposes only, and they do not establish financial, investment, or other advice. Investing in or trading crypto assets comes with a risk of financial loss.

Andrew is a blockchain developer who developed his interest in cryptocurrencies while pursuing his post-graduation major in blockchain development. He is a keen observer of details and shares his passion for writing, along with coding. His backend knowledge about blockchain helps him give a unique perspective to his writing skills, and a reliable craft at explaining the concepts such as blockchain programming, languages and token minting. He also frequently shares technical details and performance indicators of ICOs and IDOs.


