
 Home
Home News
News
- AGIX price made a bearish downfall of 25% within the last few weeks.
- The current AGIX price is $0.421 while seeing a change in the 24-hour trading volume of -13%.
- The price is predicted to increase over the next seven days.
After trading on an overall bullish trend, AGIX price is currently taking a bearish turn. The investor’s sentiments for AGIX are bullish on the long-term. The SingularityNet (AGIX) coin, after trading above the 20 EMA, broke its support and fell near the 50 EMA support line. Although the 20 EMA and 50 EMA made a convergence, chances are that the price might make a reversal in the trend, as the Relative Strength Index (RSI) line is also making a divergence.
AGIX price taking a bearish correction in a bull trend on ( Daily Timeframe)
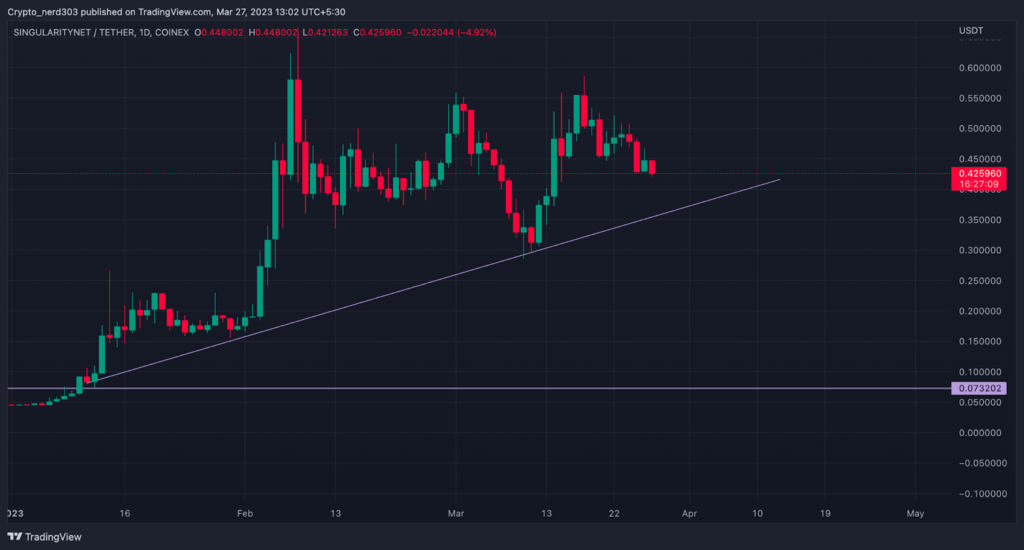
But the price has not been able to sustain above those levels. After making a bearish harami candlestick pattern ( Japanese candlestick pattern) around the top of its bull rally near early-March, the AGIX price broke its long-time support of 20 EMA. It lost 38% of its value when it made a breakdown below the 50 EMA. Because of strong support from the buyers, the price made a comeback with strong momentum while gaining 86% of its value back.
The overall market sentiments are currently trading in the greed zone near the 62 points within the greed and fear index while seeing a sharp decline of 10 points. According to Coinglass, the bears are dominating the AGIX price by 51 to 55 points.
Technical Analysis ( 1 Day Timeframe )
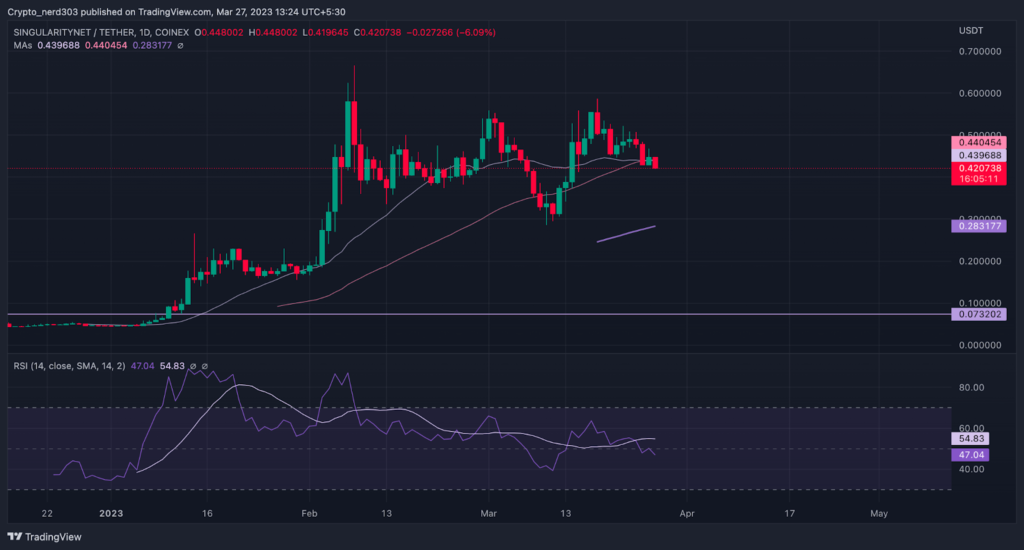
The RSI is currently taking divergence from the price action while the price is making a higher high and higher low pattern. It is making a lower high and lower low pattern. The RSI line recently crossed below the 14 SMA while trading at 47.04 points and the 14 SMA is trading at 54.83 points.
Conclusion
The AGIX price, after breaking above its near $0.100, made an extremely bullish engulfing candle, which overshadowed all the candles before it and started moving on an uptrend. It gained more than 95% while achieving consistent support from the 20 EMA. After finding support at the $0.200 price point near 20 EMA, the AGIX price again made a bullish engulfing candle and saw its all-time high while reaching the price of $0.600. The price consolidated for a little while, after making a small correction, near the 20 EMA and made a 36% bullish rally.
Technical levels:
Support – $0.200
Resistance – $0.600
Disclaimer
The views and opinions stated by the author, or any people named in this article, are for informational purposes only, and they do not establish financial, investment, or other advice. Investing in or trading crypto assets comes with a risk of financial loss.

Andrew is a blockchain developer who developed his interest in cryptocurrencies while pursuing his post-graduation major in blockchain development. He is a keen observer of details and shares his passion for writing, along with coding. His backend knowledge about blockchain helps him give a unique perspective to his writing skills, and a reliable craft at explaining the concepts such as blockchain programming, languages and token minting. He also frequently shares technical details and performance indicators of ICOs and IDOs.


