
 Home
Home News
News

- CHPT stock price has been trying to sustain and revert back towards the primary resistance level of $10.50.
- CHPT share price is trying to sustain at the 20-EMA after slipping from the symmetrical triangle pattern over the daily time frame chart.
- ChargePoint Holdings Inc. might reach the $20 recovery level if it sustains above the primary resistance.
CHPT stock price needs to recover above the primary resistance level in order to reach the $20 over the daily time frame chart. ChargePoint Holdings Inc. holds the record of the largest EV charging infrastructure all around and the CHPT share price is trying to maintain the dignity of CHPT stocks.
However, at present CHPT stock price is currently facing the low confidence motion as sellers have been barging the CHPT shares from the opening of monday’s trading session.

CHPT stock price was at $9.77 and has lost 0.61% of its market capitalization during the day’s trading session. Trading volume was still below average and needs to grow during Tuesday’s trading session. Analysts also predict the maximum recovery of CHPT shares and it may rally to reach $20 by mid 2023.
CHPT Stock Price: Technical Analysis
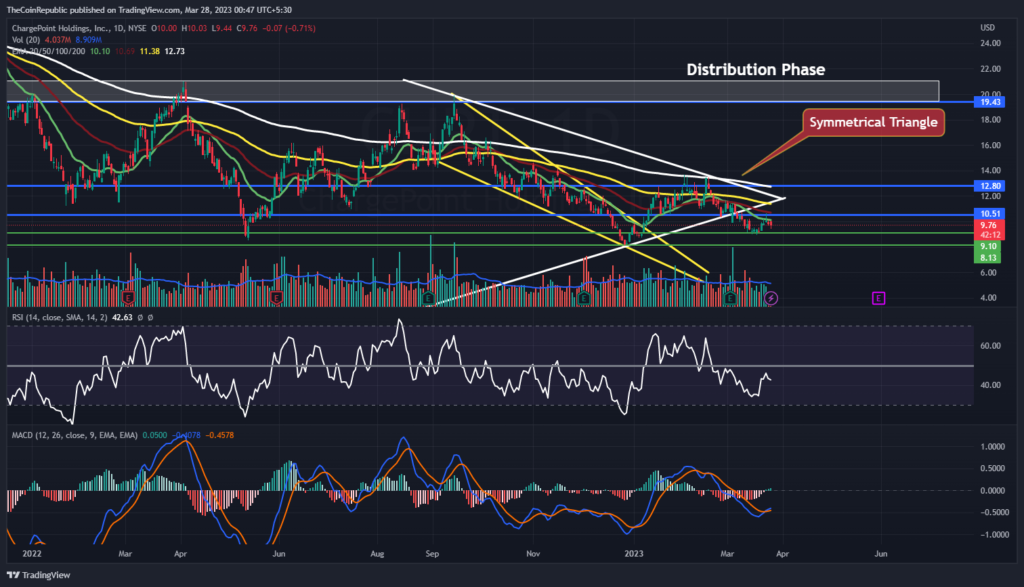
CHPT stock price has been trying to sustain and initiate its recovery phase over the daily time frame chart. CHPT shares got rejected from the symmetrical triangle pattern on 7th March and fell till $9.10. However, ChargePoint Holdings Inc stock might recover above $10 the primary resistance level and initiate its recovery phase.
CHPT share price has been trying to sustain 20-EMA to reach 50, 100 and 200-days Daily Moving Average.
CHPT stock price has gained around 4.91% in a week and 13.61% in the period of three months. Moreover, CHPT share price has gained 0.67% year to date showcasing the initialization of maximum recovery of CHPT share price.
Technical indicators suggest the sustainability issues of CHPT stock price. Relative strength index showcases the sustainability of CHPT shares. RSI was at 42 and is trying to sustain a move towards neutrality.
MACD exhibits the recovery phase of CHPT share price. The MACD line is trying to sustain and remain above the signal line after a positive crossover.
Investors in ChargePoint Holdings Inc need to wait until the CHPT share price breaks out from the primary resistance level to surge towards the $20 recovery level.
Summary
CHPT stock price needs to recover above the primary resistance level in order to reach the $20 over the daily time frame chart. CHPT share price has been trying to sustain 20-EMA to reach 50, 100 and 200-days Daily Moving Average.
Technical indicators suggest the sustainability issues of CHPT shares. Investors in ChargePoint Holdings Inc need to wait until the CHPT share price breaks out from the primary resistance level to surge towards the $20 recovery level.
Technical Levels
Support Levels: $9.10 and $8.15
Resistance Levels: $10.51 and $12.80
Disclaimer
The views and opinions stated by the author, or any people named in this article, are for informational purposes only, and they do not establish financial, investment, or other advice. Investing in or trading crypto or stocks comes with a risk of financial loss.

Nancy J. Allen is a crypto enthusiast, with a major in macroeconomics and minor in business statistics. She believes that cryptocurrencies inspire people to be their own banks, and step aside from traditional monetary exchange systems. She is also intrigued by blockchain technology and its functioning. She frequently researches, and posts content on the top altcoins, their theoretical working principles and technical price predictions.


