
 Home
Home News
News
- Fantom price is making cup with a handle on the daily timeframe
- FTM trending above the 200 EMA after retesting it, while bulls are favoring the fantom price
Fantom (FTM)has recently broken its bear trend near mid-January with strong bullish momentum. After retesting the 200 EMA fantom is showing indications of continuing the bull trend while the indicators are also favoring the bulls. The current price of Fantom is $0.52 with a change in 24-hour trading volume of 49%. Fantom is up 1.83% in the last 24 hours.
Fantom broke the 200 EMA now making a cup and handle pattern
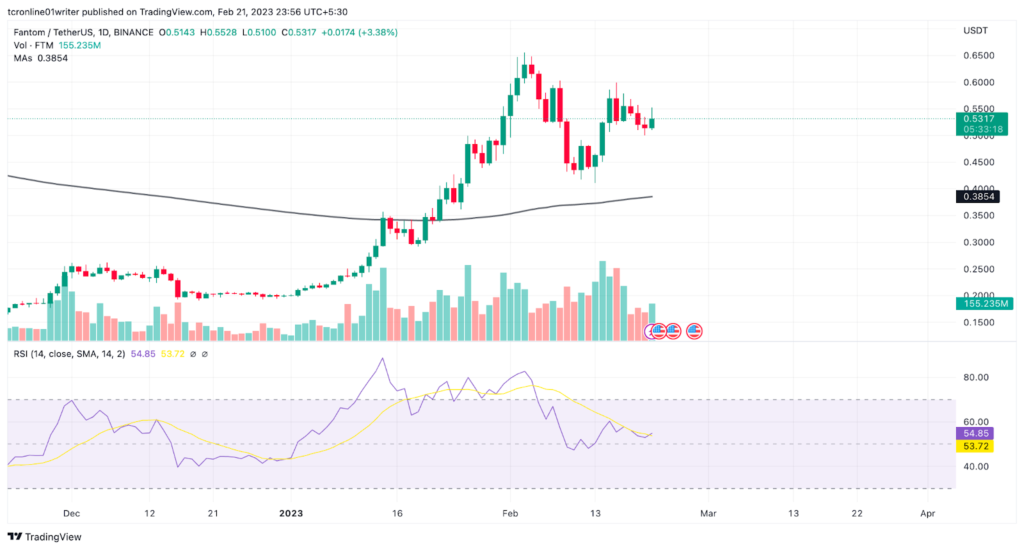
After being under the downtrend for a long time, Fantom broke out of the bear’s influence with strength officially going on a bull trend after breaking out of 200 EMA with a strong momentum rising above 83% after the small retest. As of now Fantom is making a bullish pattern of the cup and handle where the handle refers to the correction in a coin once it starts its bull trend. In the above chart, it can be clearly seen the cup and handle being made above the 200 EMA.
Technical Analysis ( 1 Day Timeframe)
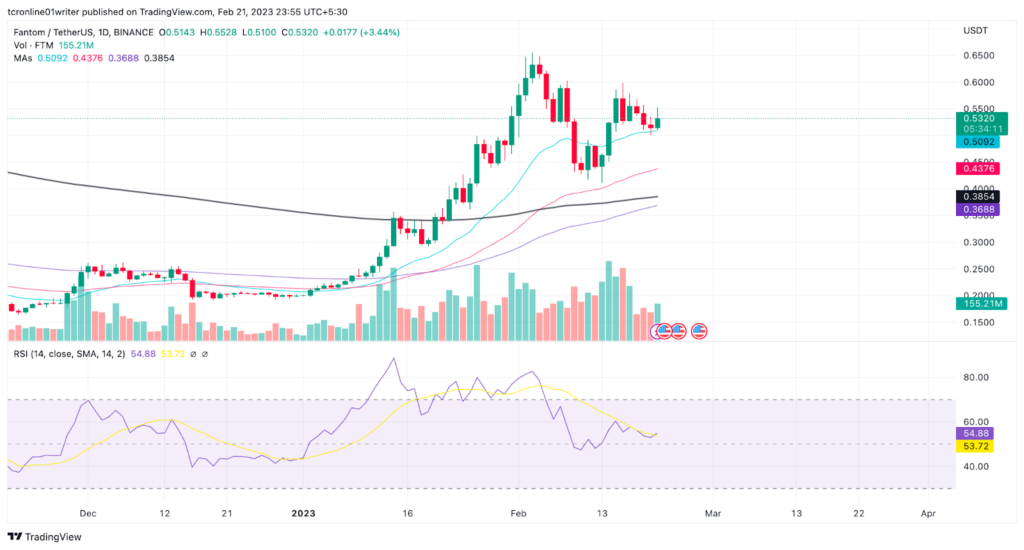
As illustrated in the above chart fantom has crossed the 200 EMA giving a golden crossover while retesting its previous resistance and current support FTM again giving a bullish rally of 32% as of now fantom is taking support from the 20 EMA while 100 EMA also seems to be indicating towards the golden crossover
Fantom is making a bullish cup and handle pattern where the base cup is being formed around level $0.421 and the handle is being formed around level $0.508. The cup and handle pattern is often found at the beginning or at the continuation of a bullish trend.
The RSI line is currently above the median line intersecting the 14 SMA around point 54.37 while the RSI curve is suggesting that the RSI line might soon state moving towards the overbought levels.
Conclusion
As it can be concluded from the above analysis FTM has recently crossed the 200 EMA while also giving some golden crossovers which as the name suggests is a bullish indicator. The price is also making a bullish pattern of the cup and handle above the 200 EMA.
Technical levels –
Support -$0.25
Resistance -$0.8
Disclaimer
The views and opinions stated by the author, or any people named in this article, are for informational purposes only, and they do not establish financial, investment, or other advice. Investing in or trading crypto assets comes with a risk of financial loss.

Andrew is a blockchain developer who developed his interest in cryptocurrencies while pursuing his post-graduation major in blockchain development. He is a keen observer of details and shares his passion for writing, along with coding. His backend knowledge about blockchain helps him give a unique perspective to his writing skills, and a reliable craft at explaining the concepts such as blockchain programming, languages and token minting. He also frequently shares technical details and performance indicators of ICOs and IDOs.


