
 Home
Home News
News

- Quant price prediction suggests a rise in the long term and is expected to generate positive returns.
- It showed a decent recovery of about 16% from the recent low.
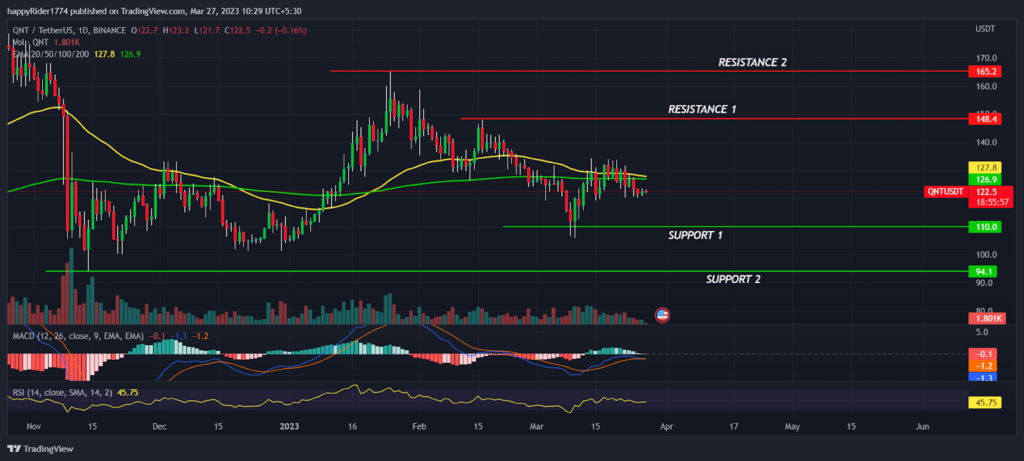
- Quant price struggles to trade above the 50 and 200 day EMA.
Quant price prediction suggests a rise in the long term and is expected to generate a positive return for its investors. It defends $110.00 support level and has recovered about 16% from the recent low swing. This means that responsive buyers are active at the lower levels. However, the Quant crypto price is struggling to regain the 50 day and 200 day EMA, which seems to be acting as an immediate hurdle for the bulls.

Quant price is trading at $122.50 with an intraday decline of -0.16% and 24 hour volume to market cap ratio is at 0.009. The QNT/BTC pair is trading at 0.004394 with an intraday rise of 0.16%, which shows minor divergence between the direction of both the pairs. At the beginning of January, Quant price formed a double bottom bullish pattern and successfully broke out of the neckline hurdle, which triggered the upward momentum.

It also managed to climb above the 50 and 200 day EMA, which gave confirmation of the trend reversal. Quant price later started to rise upward by forming higher high candles and rallied 35%.
Will Quant Price Continue the Momentum?
Quant price attempted to break out of the $160.00 mark to showcase the strength of buyers, but it witnessed minor profit booking from the higher levels. Quant crypto price later lost the momentum and started falling.
In mid-February, Quant price again tried to retest the previous highs but was unsuccessful, and prices slipped below both the EMAs. And in mid-March, the price hit low at 106.00 and ended up forming a bullish engulfing candle. Prices later showed some decent bounce, with the bulls trying to cover the previous losses.
Quant price might gain momentum if it sustains above both the EMAs. Till then, the short term trend is still in a downward direction.
Quant Price Formed a Short Term Base
Quant price is consolidating near the demand zone and showing signs of short term base formation. The probability of reaching $160 is high but the price will only gain momentum when it holds above both the EMAs. Technical indicators like MACD had generated a negative crossover, which indicates mild bearishness. The Relative Strength Index (RSI) at 44 sloping sideways shows that prices might strike the neutral territory in the coming days.
Conclusion
Quant price prediction suggests a rise in the long term but the prices will gain upward momentum when it sustains above both the EMAs. According to technical analysis, Quant crypto price is showing signs of the base formation and expected to respect the support level mentioned below.
Technical levels
Resistance levels : $148.00 and $165.00
Support levels : $110.00 and $94.00
Disclaimer
The views and opinions stated by the author, or any people named in this article, are for informational purposes only, and they do not establish financial, investment, or other advice. Investing in or trading crypto assets comes with a risk of financial loss.

Andrew is a blockchain developer who developed his interest in cryptocurrencies while pursuing his post-graduation major in blockchain development. He is a keen observer of details and shares his passion for writing, along with coding. His backend knowledge about blockchain helps him give a unique perspective to his writing skills, and a reliable craft at explaining the concepts such as blockchain programming, languages and token minting. He also frequently shares technical details and performance indicators of ICOs and IDOs.


