
 Home
Home News
News

- The EOS’s price is currently trading at $1.10 with a change in the 24-hour trading volume of 73.43 percent
- The EOS price is down 2.18 percent in the last 24 hours
The EOS price after trading under the bull’s influence is currently taking a bearish turn while seeing a sudden spike in the trading volume stating that buyers and sellers are trading this coin actively. While the price action is currently going sideways. The price is currently taking consistent support from the $0.800 support point while taking resistance from the price of $1.200. Although the price did make several attempts to break out of its resistance it is yet to start trading on a trend.

EOS price is making a downward curve on the (Daily Timeframe)
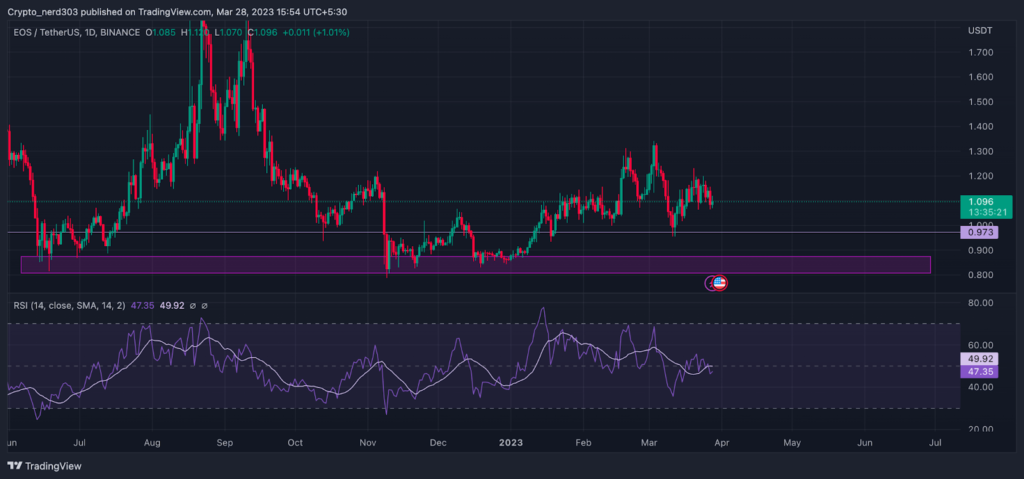
The EOS price after taking support from the price of $0.900 early in mid-Jun made a reverse head and shoulder pattern after which it started moving on a bullish trend after making an engulfing candlestick pattern. The price gained 83 percent of its value back however after taking resistance from near $1900 twice EOS price made a severe downfall of 52 percent.

Although after taking support from the $0.800 twice and making a double-bottom the price made a bullish rally of 21 percent and started trading under a consolidation. After making a breakout it again attempted to start making a bull trend but the price was not able to breach the $1.300 level.
After taking resistance from $1.300 the price took a major downfall of 27 percent although after taking support from the price of $1.000 as of now it is currently trading under consolidation in the demand zone. However, the making of the downward curve made in the supply zone from the price action is suggesting that it might make a bearish turn. If it crosses below the $1.065 price then it will take a correction of 10 percent while coming towards its support level of $1.000. While its current resistance is around $1.200 12 percent above the current price.
The overall market sentiments are currently according to the greed and fear index. The market sentiments are currently trading in the greed zone of around 59 points while observing a decline of 7 points since the last week according to the Alternative(dot)me site
The RSI line is currently taking resistance from the median line. The current RSI value is 47.35 points trading below the 14 SMA which is trading at 49.92 points. The RSI line is making a downward curve going toward the oversold levels.
Technical levels –
Support -$66.0
Resistance – $80.0
Disclaimer
The views and opinions stated by the author, or any people named in this article, are for informational purposes only, and they do not establish financial, investment, or other advice. Investing in or trading crypto assets comes with a risk of financial loss.

With a background in journalism, Ritika Sharma has worked with many reputed media firms focusing on general news such as politics and crime. She joined The Coin Republic as a reporter for crypto, and found a great passion for cryptocurrency, Web3, NFTs and other digital assets. She spends a lot of time researching and delving deeper into these concepts around the clock, and is a strong advocate for women in STEM.


