
 Home
Home News
News
- The LTC price is currently trading at $90.16 while seeing a change of 7.39% in 24-hour trading volume.
- The LTC price is observing a decline of 1.31% in the last 24 hours.
- The LTC price may see a decline of 17% in the coming days.
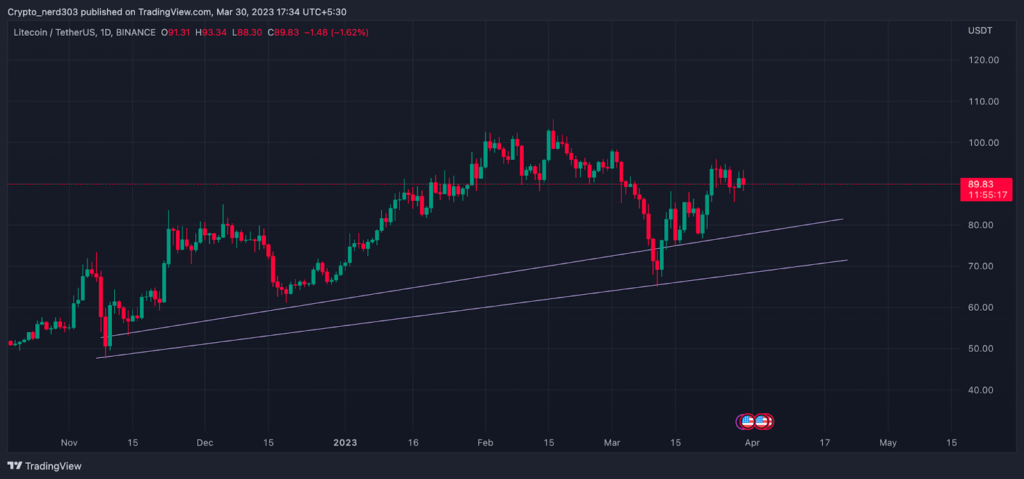
The LTC price has been trading under a bullish trend for the last couple months after crossing above the 200 EMA in mid-November. But now it seems like the sellers might start stepping in and the price could take a small bearish correction in the ongoing uptrend. At present, the LTC price is trading at the supply zone near its previous high after making a bullish rally of 44%, the price also made a bullish morning star pattern near the beginning of the trend. As of now, the price is making a spinning top candlestick pattern in the supply zone.
The LTC price moving on an uptrend on the (Daily Timeframe)
The overall market sentiments are currently in the greed zone of around 60 points while seeing an increase of 3 points last week, when the market sentiments were around 57 points in the greed and fear index, according to the Alternative(dot)me. The sellers are dominating the majority of cryptocurrency exchange platforms, as per Coinglass, by 51 to 54%.
Technical Analysis ( 1 Day Timeframe )
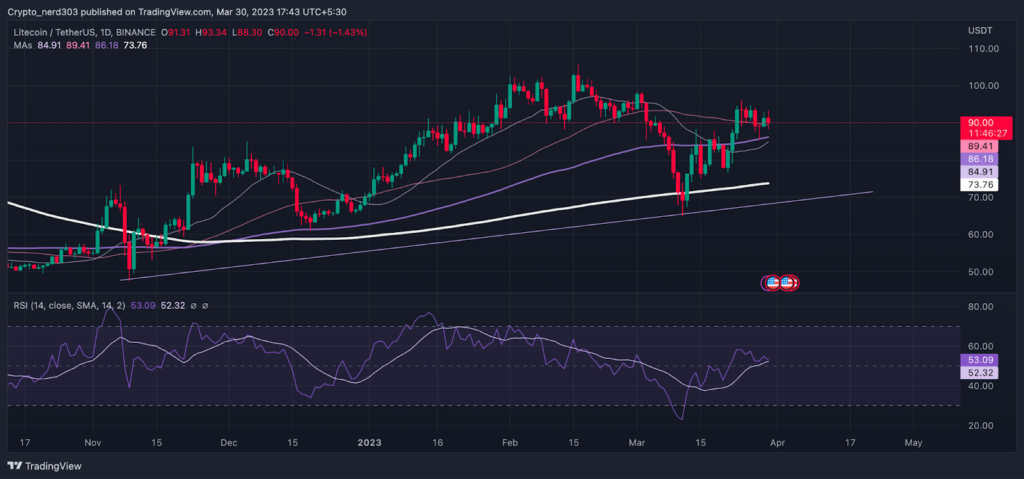
The LTC price is currently trading above all the major key 20/50/100/200 indicators. After taking support from the $50.00 level, the LTC price made an engulfing candle pattern and crossed above the 200 EMA with a strong momentum. The 20/50/100 EMA’s also crossed above the 200 EMA making a golden crossover with a bullish EMA divergence indicating big movement in the price action. The price then gained 78% of its overall value back. Currently, the price is trading above the 100 EMA while finding support from the 50 EMA.
The RSI line is currently moving above the median line while establishing support from the 14 SMA. If the SMA crosses below the median line and the 14 SMA, it will confirm the trend reversal. The current RSI value is 53.09 points while the 14 SMA is providing support around 52.32 points. The downward curve in the RSI line suggests that it might start moving toward the oversold levels.
Technical levels –
Support -$73.0
Resistance – $100.0
Disclaimer
The views and opinions stated by the author, or any people named in this article, are for informational purposes only, and they do not establish financial, investment, or other advice. Investing in or trading crypto assets comes with a risk of financial loss.

Nancy J. Allen is a crypto enthusiast, with a major in macroeconomics and minor in business statistics. She believes that cryptocurrencies inspire people to be their own banks, and step aside from traditional monetary exchange systems. She is also intrigued by blockchain technology and its functioning. She frequently researches, and posts content on the top altcoins, their theoretical working principles and technical price predictions.


