
 Home
Home News
News

- Sofi stock price is facing resistance at downward sloping trendline.
- Sofi stock (NASDAQ: SOFI) stock price seems to be stuck in the narrow range.
- Sofi Technologies stock price trading below 50 and 200 day EMA is showcasing downtrend.
Sofi stock price is down by 12.88% on a monthly basis and forming a bearish continuation pattern. Sofi stock price had rejected the 200 day EMA and also slipped below the 50 day EMA, showcasing that positional trend is on a downward direction. Recently, Sofi stock broke down the important support level of $6.00, which triggered a negative sentiment and prices witnessed massive selling.

Sofi stock price has defended the $5.00 and showed some decent recovery, but prices seem to be getting stuck in the range between $5.00 to $6.00. Sofi Technologies (NASDAQ: SOFI) stock price closed the previous day at $5.75 with an intraday rise of $2.86% and market capitalization at $5.37 billion.

Sofi Technologies (NASDAQ: SOFI) released fourth quarter earnings on 30th January 2023. The company successfully met the analyst estimates. Prices later reacted positively in the earnings and shot up about 23% in a short period of time.
Will Sofi Stock Price Break The Trendline?
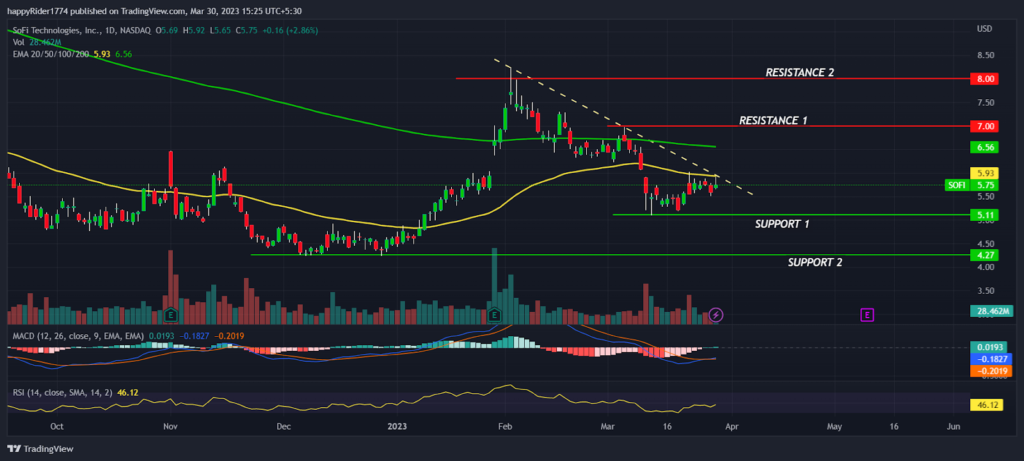
Sofi stock price hit a high swing at $8.24 but ended the session by forming a shooting star bearish candle pattern. Later, Sofi stock began to decline by forming lower low swings. As such, $8.00 will act as a supply zone in the coming months.
Sofi stock (NASDAQ: SOFI) consolidated for a few weeks and bulls tried to retest the previous highs but it faced rejection from the trendline. After forming a short term base near $5.00, Sofi stock is again facing hurdle to break the trendline.
Technical analysis suggests that Sofi price is in a downtrend and the probability of a breakout is low. However, if the prices successfully regain the 50 day EMA, there might be a relief rally from the lower levels.
Sofi Stock Price Near Demand Zone
Sofi Stock price is trading near the demand zone and forming a bullish hammer candle pattern on a weekly basis. However, prices will gain momentum when it breaks out of the $6.00 level. On the other hand, if the price drops below $5.00, the bears will try to drag it down toward the yearly lows.
Conclusion
Sofi stock price is in a downtrend and facing hurdle at a downward sloping trendline. Technical analysis suggests that Sofi stock (NASDAQ: SOFI) is in a bear grip and the probability of a range expansion is low. However, if bulls successfully push the price above the 50 day EMA, then a short term relief rally might get triggered from the lower levels.
Technical levels
Resistance levels : $7.00 and $8.00
Support levels : $5.00 and $4.27
Disclaimer
The views and opinions stated by the author, or any people named in this article, are for informational purposes only, and they do not establish financial, investment, or other advice. Investing in or trading crypto assets comes with a risk of financial loss.

Andrew is a blockchain developer who developed his interest in cryptocurrencies while pursuing his post-graduation major in blockchain development. He is a keen observer of details and shares his passion for writing, along with coding. His backend knowledge about blockchain helps him give a unique perspective to his writing skills, and a reliable craft at explaining the concepts such as blockchain programming, languages and token minting. He also frequently shares technical details and performance indicators of ICOs and IDOs.


