
 Home
Home News
News
- 1 The ARB price is currently trading at $1.35 while seeing a change of 82% in 24-hour trading volume.
- 2 The ARB price is observing a decline of 11.82% in the last 24 hours.
Arbitrum(ARB) is an Ethereum layer 2 scaling solution. Arbitrum uses optimistic rollers to achieve speed, scalability, and cost efficiency on Ethereum. Another benefit of ARB is that it gives higher throughput and has lower fees in comparison to Ethereum. This happens because of the computation and storage load-off chain.
Arbitrum will launch its own layer three solution called Orbit which helps users deploy the program written in popular programming languages like rust and C++. ARB is also expanding its validator set to include more institutional validators. Arbitrum also announced its airdrop of ARB on 16 March 2023. The token was airdropped to early users and DAO building on Airbitrum with 12.75% of the total supply to be distributed.
ARB price is making a reverse head and shoulder pattern on the (Daily Timeframe)
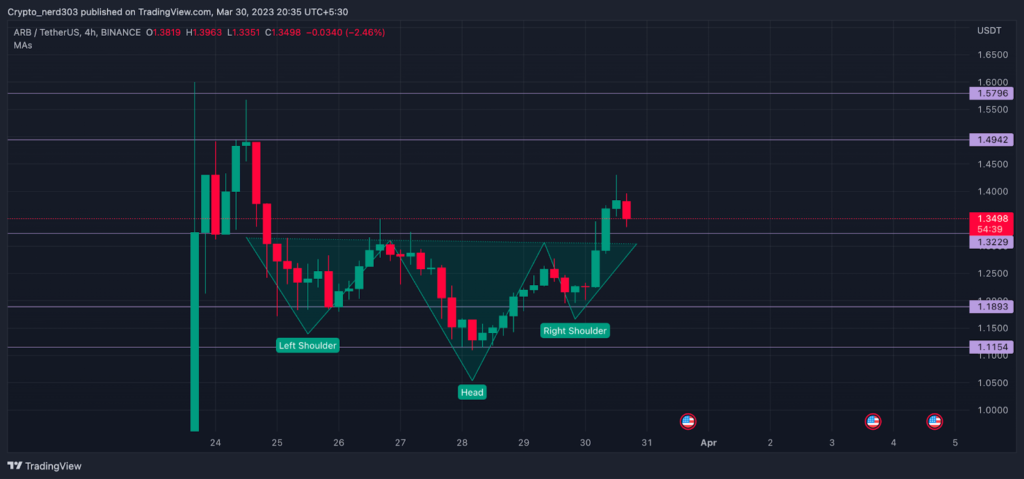
The ARB price gained strong buyers’ support in late March when the price made a bullish movement of more than 95%. After facing resistance at $1.5500 price, the ARB coin made a doji candlestick pattern showing exhaustion in the bull trend. The price lost 24% of its value although it gained the buyer’s support near $1.2000 and made a recovery rally of 12%. After finding support from the previous support level, the price is currently making a bullish reverse head and shoulder pattern, which is a bullish pattern.
The overall market sentiments are currently in the greed zone of around 60 points. It recorded an increase of 3 points last week, when the market sentiments were around 57 points in the greed and fear index, according to the Alternative(dot)me.
Technical Analysis ( 4 Hr Timeframe )
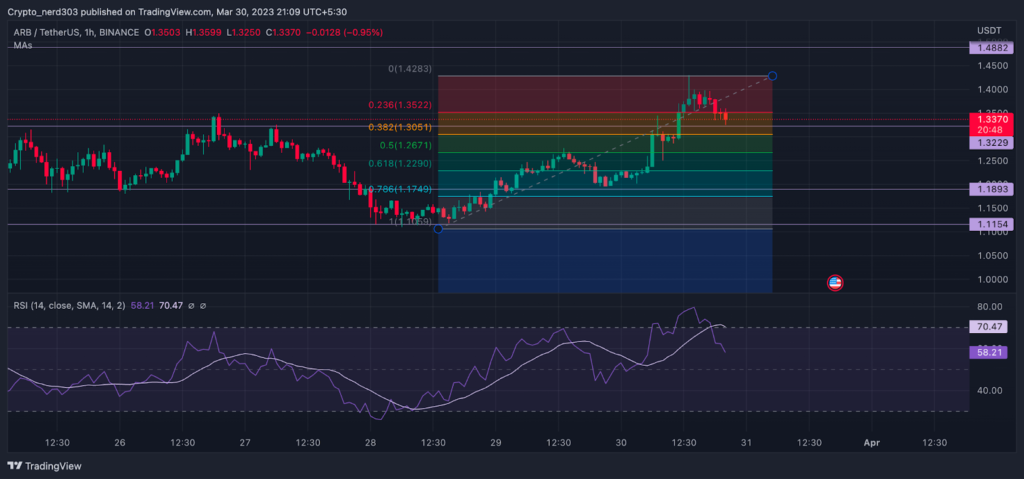
The price is currently taking a reversal from the top level of Fibonacci levels around $1.4283 points while moving on an uptrend. Its golden support level is just below the current price of around $1.3051 level. The RSI line recently crossed below the 14 SMA and its current value is 58.21 points. The 14 SMA line is trending just above the overbought level of around 70.47 points, providing critical resistance to the RSI line. The RSI line below the 14 SMA suggests that it might continue moving toward the oversold level although it has a support point around the median line.
Technical levels –
Support -$1.3229
Resistance – $1.4500
Disclaimer
The views and opinions stated by the author, or any people named in this article, are for informational purposes only, and they do not establish financial, investment, or other advice. Investing in or trading crypto assets comes with a risk of financial loss.
Steve Anderson is an Australian crypto enthusiast. He is a specialist in management and trading for over 5 years. Steve has worked as a crypto trader, he loves learning about decentralisation, understanding the true potential of the blockchain.


