
 Home
Home News
News

- The CSPR price is currently trading at $0.041 while seeing a change of 94.54% in 24-hour trading volume.
- The CSPR price is observing a decline of 8.45% in the last 24 hours.
- The Casper price gained 25% of its value within the last couple of weeks,
The CSPR price is trying to make a comeback from its recent bearish downfall. The price is getting the buyer’s strong support after seeing downfall in early March wherein it fell below its trend line.

This suggests that the investor’s sentiments regarding Casper are bullish. After finding support around 100 EMA, the price is making another attempt to resume its bull trend. The oscillators, volume, and EMA’s are also providing bullish indications.

CSPR price trading near the supply zone on the (Daily Timeframe)
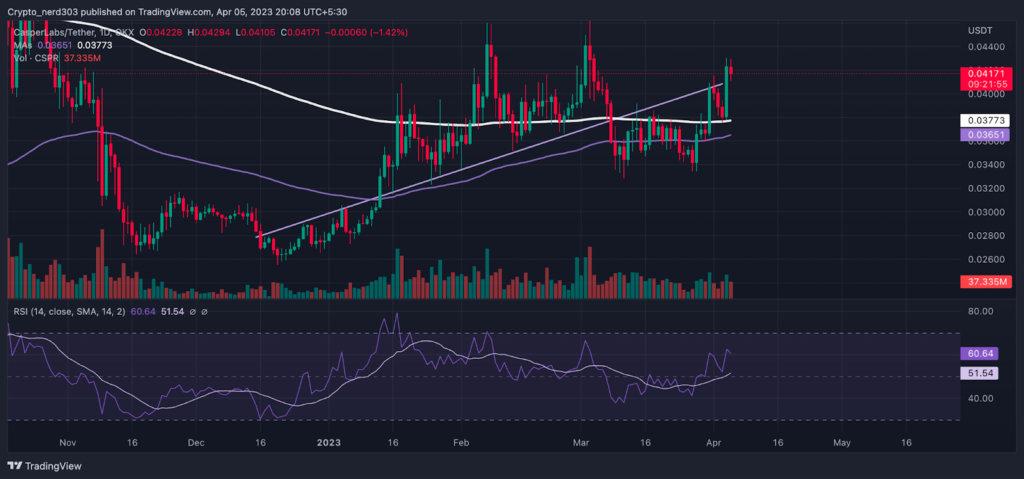
The Casper price changed its trend from the bear’s to the bull’s favour near mid-December. Casper coin, after crossing above the 50 EMA, made an extremely bullish rally of around 30% but after the bullish rally, it was not able to find the buyer’s support and the price recorded a sharp rejection from 200 EMA. The CASPR price made another retest again and was able to make a breakout with a strong bullish candle pattern, after which it started trading on an uptrend.
The market sentiments are currently in the greed zone of around 62 points in the greed and fear index. The overall sentiments of the market are currently observing an increase of 5 points since the last week when they were around 57 points, according to Alternative(dot)me.
Technical Analysis ( 1 Day Timeframe )
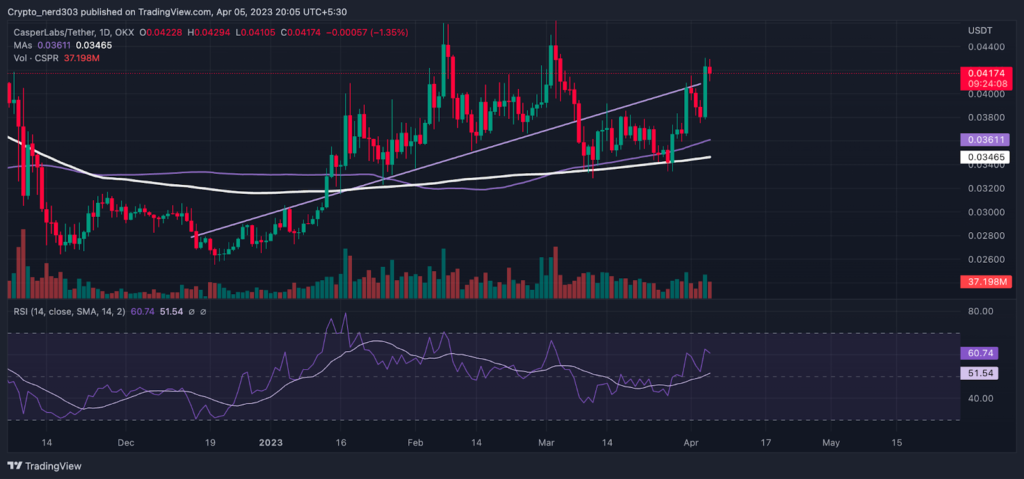
The Casper price is favouring the MA rather than the EMA’s as can be observed in the illustrations given above. The price recently made a bullish double-bottom pattern, finding support from the 200 and 100 MA, after which the price started moving on a bullish trend. Now the price is suggesting that it can make a small correction before continuing the trend.
The RSI line has recently crossed above the median line and 14 SMA which is a bullish indication as is being reflected by the price action. The current RSI value is 60.74 points where it is consistently finding support from the 14 SMA. The 14 SMA is trending just above the median line around 51.54 points.
Technical levels –
Support -$0.036
Resistance – $0.046
Disclaimer
The views and opinions stated by the author, or any people named in this article, are for informational purposes only, and they do not establish financial, investment, or other advice. Investing in or trading crypto assets comes with a risk of financial loss.

Nancy J. Allen is a crypto enthusiast, with a major in macroeconomics and minor in business statistics. She believes that cryptocurrencies inspire people to be their own banks, and step aside from traditional monetary exchange systems. She is also intrigued by blockchain technology and its functioning. She frequently researches, and posts content on the top altcoins, their theoretical working principles and technical price predictions.


