
 Home
Home News
News

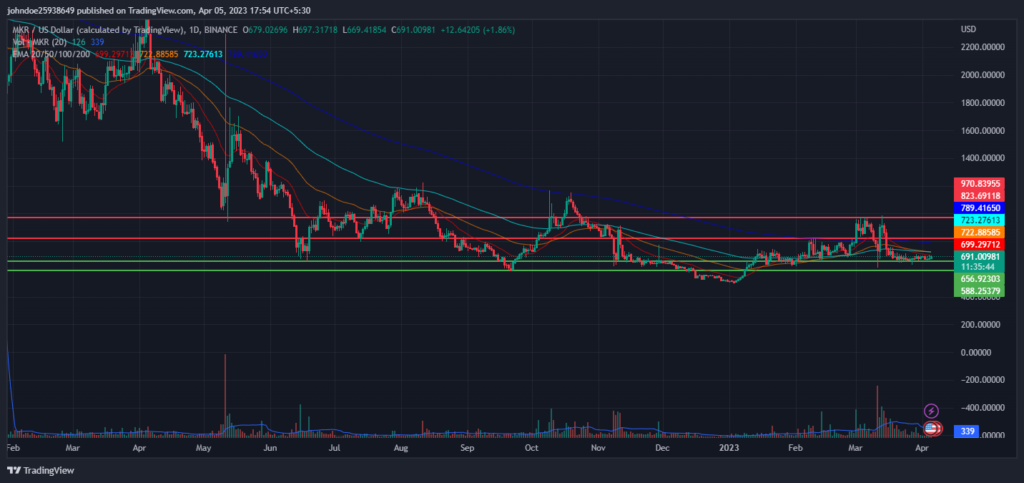
- Maker is currently trading at $695.29 (press time) with an increase of 2.93% intraday.
- The 24-hour low for MKR was $674.37; the 24-hour high was $696.31.
- The current Maker price is below the 20-, 50-, 100-, and 200-Day EMAs.
The MKR/BTC pair was trading at 0.000003773 BTC with a rise of 1.43% intraday. Maker price has fell 71.49% in 2022 indicating bearish domination on MKR coin. The stock was highly volatile throughout 2022.

After making its 52-week high, MKR was bearish and with the 50-Day EMA acting as a major resistance. Due to this bear market the token price fell till its primary support of $656.92.After this, the buyers became active again in the market going toe-to-toe with the sellers to keep the token price above the primary resistance of $823.69.However, near the end of 2022, the buyers gave in which caused the token price to fall below the secondary resistance, making its new 52-week low.

Since the start of 2023, MKR token began its upward movement, but after reaching its primary resistance the token price began consolidating between its primary support and resistance. However, after the token price reached the secondary resistance of $970.83, the sellers pushed MKR token below its primary resistance. The formation of the evening star candlestick pattern after the uptrend may be one of many causes which caused the prior downtrend as can be seen over the 1-day chart.
The trading volume of the coin decreased by 9.95% in the last 24 hours.
Maker Technical Indicators:
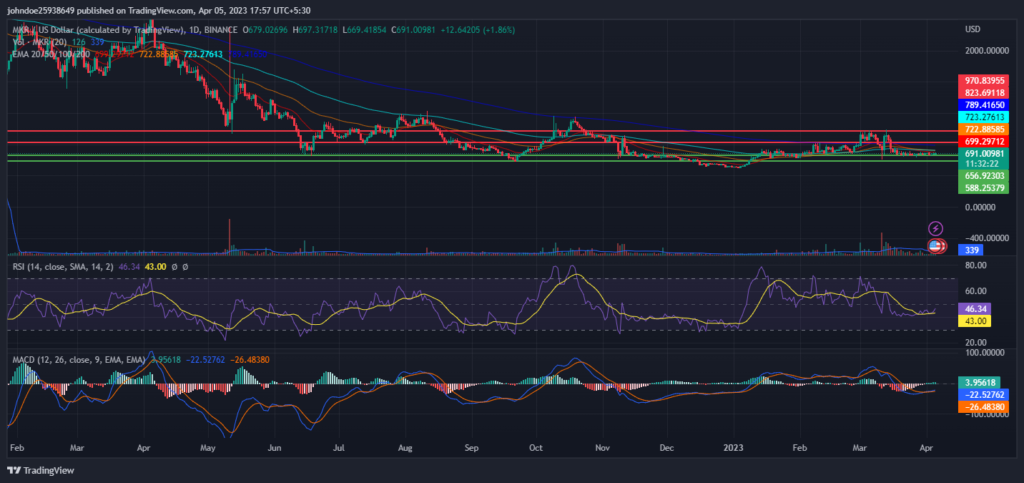
The Relative Strength Index (RSI) is increasing in the oversold zone and displayed a positive crossover, indicating that the buyers are in the majority and pushing MKR upwards. The current value of RSI is 46.34, which is above the average RSI value of 43.00.
However, the MACD and the signal line are increasing and shows a positive crossover on the 1-day chart.
Conclusion
Maker price prediction movement suggests that it is currently consolidating after the prior downfall, caused by the formation of the evening-star candlestick pattern.
RSI and MACD both are increasing and showed a positive crossover over the daily trading chart which shows strength in the current uptrend. This creates great opportunities for the long traders.
Technical Levels
Resistance level- $823.69 and $970.83
Support level- $656.92 and $588.25
Disclaimer
The views and opinions stated by the author, or any people named in this article, are for informational purposes only, and they do not establish financial, investment, or other advice. Investing in or trading crypto assets comes with a risk of financial loss.

Nancy J. Allen is a crypto enthusiast, with a major in macroeconomics and minor in business statistics. She believes that cryptocurrencies inspire people to be their own banks, and step aside from traditional monetary exchange systems. She is also intrigued by blockchain technology and its functioning. She frequently researches, and posts content on the top altcoins, their theoretical working principles and technical price predictions.


