
 Home
Home News
News
- Avalanche is currently trading at $17.81 (press time) with a decrease of 2.16% intraday.
- The 24-hour low for AVAX was $17.70; the 24-hour high was $18.31.
- The current Avalanche price is below the 50-, and 200-Day EMAs.
The AVAX/BTC pair was trading at 0.0006391 BTC with a rise of 0.21% intraday. Avalanche price has fallen 80.41% in 2022, indicating bearish domination on the AVAX coin. After making its new 52-week low near the end of the previous trading year, the AVAX price again started moving upward with the help of the accumulated active buyers present in the market. This resulted in the token price breaking its primary and secondary support as well as the primary resistance of $18.024.
However, the formation of the evening star candlestick pattern over the daily time chart after an uptrend might be the cause of the prior downtrend. This downtrend caused the AVAX price to fall to the secondary support of $14.141, as can be seen on the daily time frame chart. After that, the bulls again tried to carry the token upward, but this time the price faced rejection by the primary resistance. This can be attributed to a lack of active buyers in the market.
Avalanche price prediction suggests if the downward pattern holds, then the token price may ultimately reach secondary support. Additionally, if the bears’ defences weaken, the buyers will try to push AVAX even harder to keep up its potential. This would cause the price to hit the primary resistance and move in the direction of the secondary resistance.

The trading volume of the coin decreased by 12.12% in the last 24 hours, indicating a relationship between the trading volume and the price of AVAX and decreasing bullish intent.
Avalanche Technical Indicators
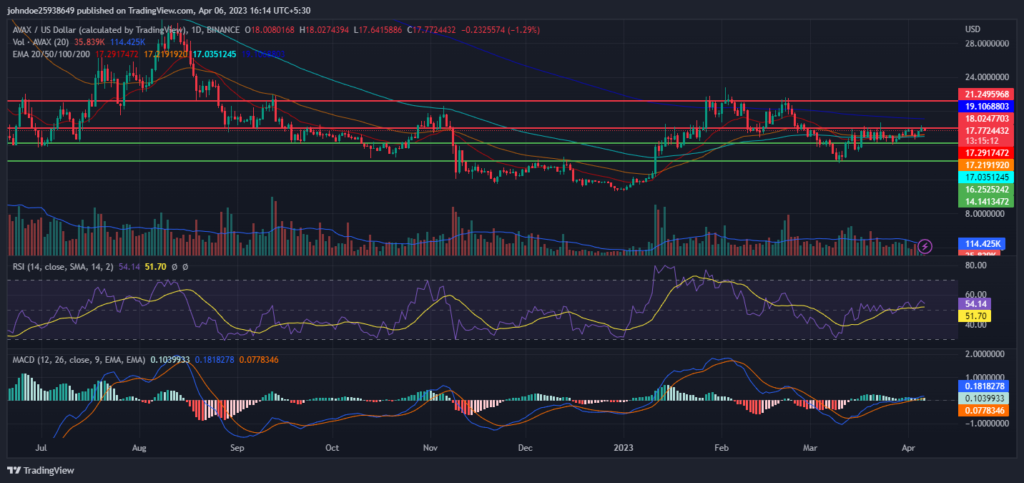
The Relative Strength Index (RSI) is decreasing in the overbought zone and might display a negative crossover, indicating that the sellers are in the majority and pushing AVAX downwards. The current value of RSI is 54.74, which is above the average RSI value of 51.74.
However, the MACD and the signal line are increasing on the 1-day chart, contradicting RSI claims.
Conclusion
Avalanche price prediction suggests that if the downward pattern holds, then the token price may ultimately reach secondary support. The sudden decrease in the trading volume shows negative market sentiment toward the AVAX token.
RSI is decreasing in the overbought zone and might show a negative crossover, showing strength in the bearish trend. However, the increasing MACD and the signal line contradict the RSI. Traders should make trades in the current market cautiously.
Technical Levels
Resistance level- $18.02 and $21.24
Support level- $16.25 and $14.14
Disclaimer
The views and opinions stated by the author, or any people named in this article, are for informational purposes only, and they do not establish financial, investment, or other advice. Investing in or trading crypto assets comes with a risk of financial loss.

Andrew is a blockchain developer who developed his interest in cryptocurrencies while pursuing his post-graduation major in blockchain development. He is a keen observer of details and shares his passion for writing, along with coding. His backend knowledge about blockchain helps him give a unique perspective to his writing skills, and a reliable craft at explaining the concepts such as blockchain programming, languages and token minting. He also frequently shares technical details and performance indicators of ICOs and IDOs.


