
 Home
Home News
News

- AXS price forms a pennant pattern, is likely to produce a break out soon.
- The EMA forms a bullish crossover, AXS price rose by 3.81%.
Axie Infinity (AXS) forms lower highs and higher lows, making a pennant pattern for AXS. The sideways moving price nears a bullish breakout taking support of all technical aspects. The recent price hints at an uptrend that is likely to arrive in a few days. The uptrend aims at the higher price ranges to mark a new high for 2023.

The Picturesque
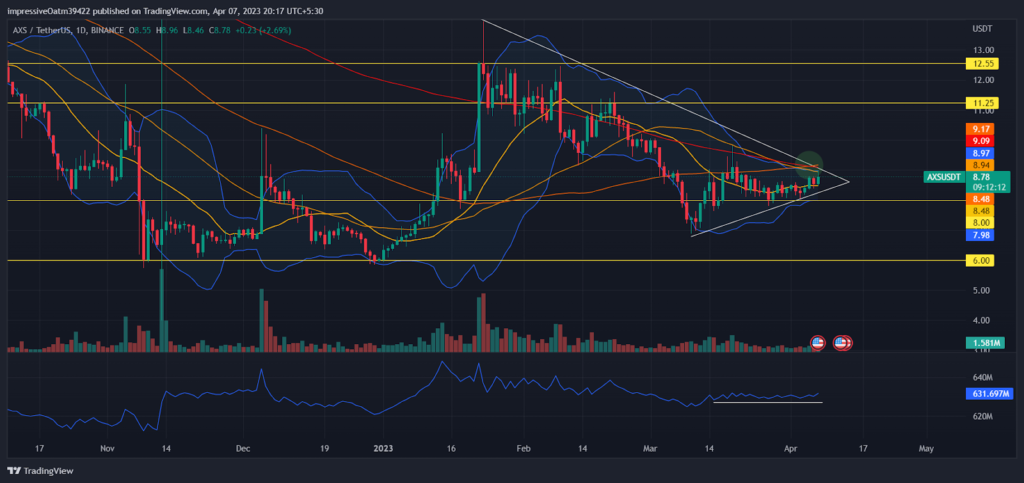
AXS price forms a pennant pattern and hints at a stronger bullish breakout. The price formed a higher lows, making the bottom line rise. The trading volume observed a spike, suggesting that the buyers are flooding the market. Recent developments in the AXS ecosystem supported the bullish trend for AXS. The flat laying OBV suggests a stagnant market which is currently neutral in influence. The EMA ribbon forms a golden cross suggesting that a high run is likely in the coming days. AXS price took an uptrend after taking support at $8.00. The Bollinger Bands contract to show reduced volatility and prepare for a rise.

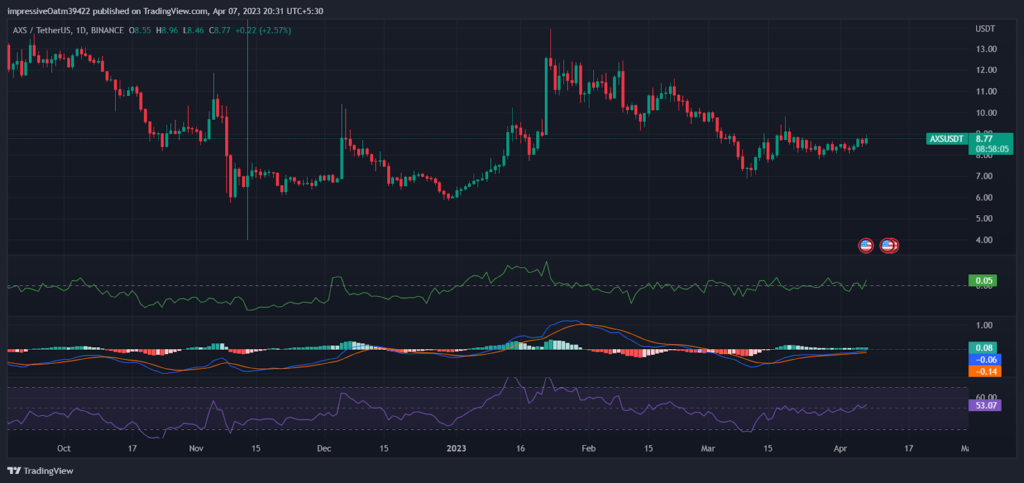
AXS price moves sideways to prepare for the upcoming rise. The CMF spikes up to suggest the present as well as upcoming bullish trend in AXS price. The uptick can move higher to show a robust rally. The MACD continues in the positive cross and records buyer action for AXS. The constant buyer action depicts the consistent bullish trend in the market. The RSI suggests rising buyer influence as the indicator moves above the half line.
A Smaller Window
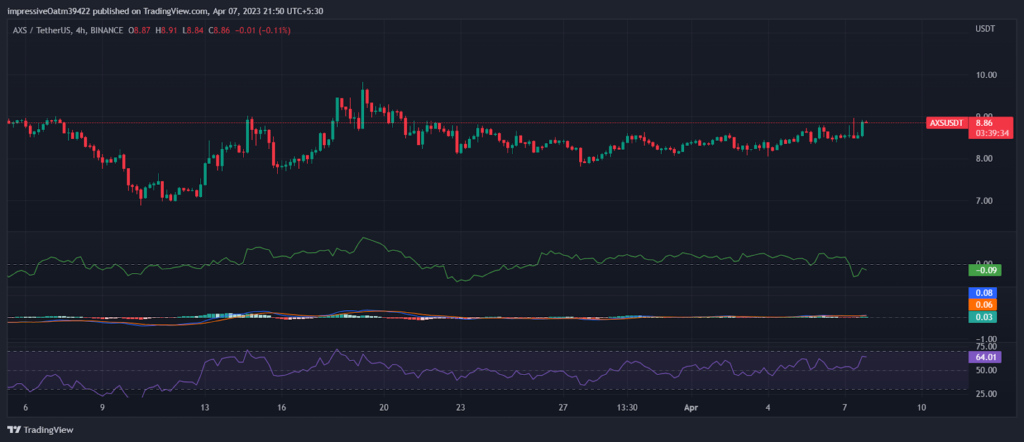
AXS price in the shorter time frame suggests the price could show a staggered rise and could try to break the imaginary resistance of $9.00. The CMF drops down sharply to indicate the previous fall but saw an uptick to suggest the upcoming bull trend. The MACD lines coincides with the zero-histogram mark and suggests mixed market sentiments. The non-existent MACD indicates that the market is yet to decide its influence. The RSI shoots up to reflect the growing buyers and mirror arriving bulls.
Conclusion
AXS price forms a pennant pattern and moves towards a bullish breakout. The arriving bulls may witness buyers crowding the market and running a buying spree. The recent developments prove favorable for AXS and support in forming a rally. The bulls may face resistance near $11.25. The start of the projected rally takes place after taking support near $8.00.
Technical levels
Support levels: $8.00 and $6.00
Resistance levels: $11.25 and $12.55
Disclaimer
The views and opinions stated by the author, or any people named in this article, are for informational purposes only and do not establish financial, investment, or other advice. Investing in or trading crypto assets comes with a risk of financial loss.

Andrew is a blockchain developer who developed his interest in cryptocurrencies while pursuing his post-graduation major in blockchain development. He is a keen observer of details and shares his passion for writing, along with coding. His backend knowledge about blockchain helps him give a unique perspective to his writing skills, and a reliable craft at explaining the concepts such as blockchain programming, languages and token minting. He also frequently shares technical details and performance indicators of ICOs and IDOs.


