
 Home
Home News
News

- VET price rose by 4.81% in a week’s time, forming a rising channel.
- The price faced rejection near $0.02485 and started to fall.
VeChain price action formed a rising channel on the daily time frame, and after a bearish engulfing candle, started a downtrend. The price faced a rejection near the resistance of $0.02485, after which it fell during the intraday session. The trading volume suggests a declining but volatile market for VeChain.

The Monoscope
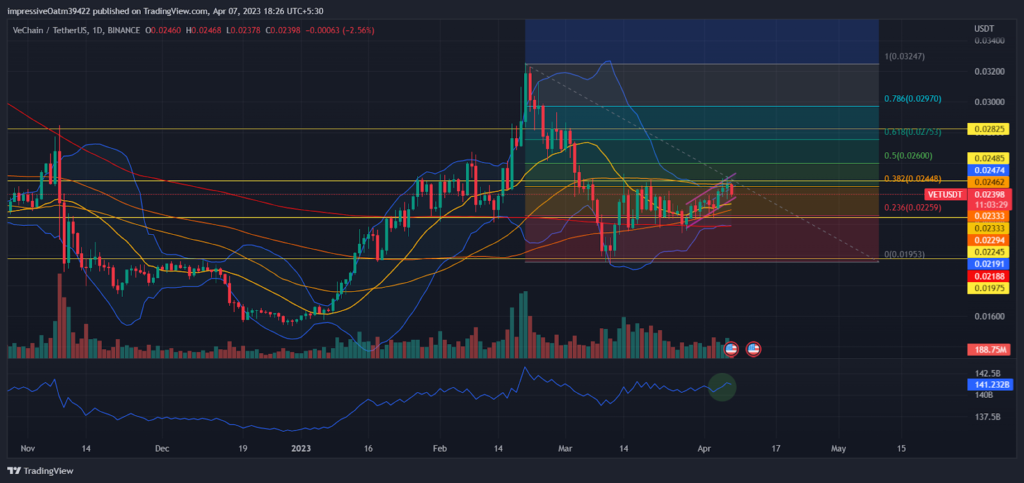
VET price recently formed a short rising channel, indicating a bullish trend in the market for Vechain. Rising prices may soon correct by falling to the support near $0.02245, and then consolidate for a short period of time. The EMA ribbon lays below the current price action, which can be reclaimed by the falling price trend, making it bearish from bullish. The Bollinger Bands contract to show declining volatility in VET price. The downtick in OBV suggests the market entered a downtrend.

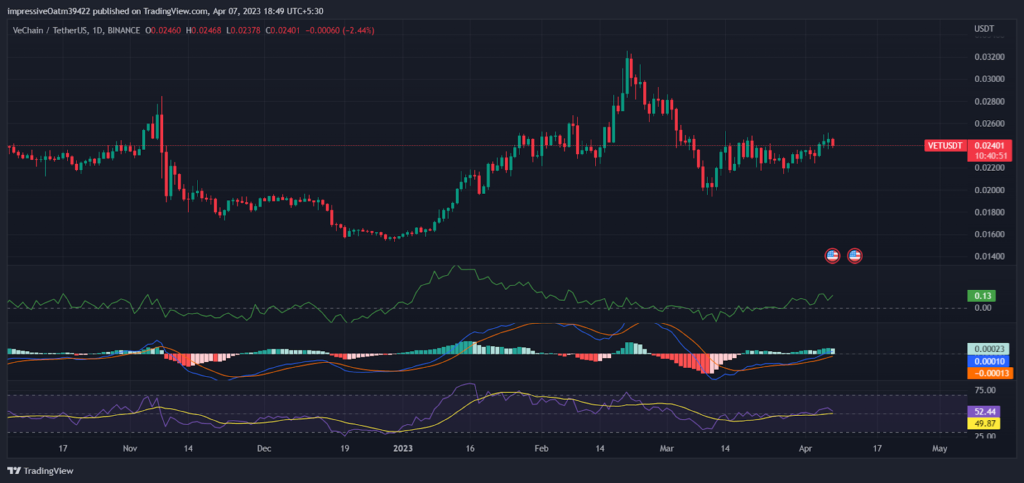
VET price pattern has made the indicators take a turn. The CMF bounces giving out mixed signals, marking an ambiguous market for VeChain. The MACD narrows the divergence and starts to record declining buyer bars. The decline in the MACD indicates the market is under selling pressure. The RSI moves around the half line to suggest a neutral market for VET. The market can be dormant – disguised as neutral and suggest a stagnant movement for the price in the coming days.
The Microscope
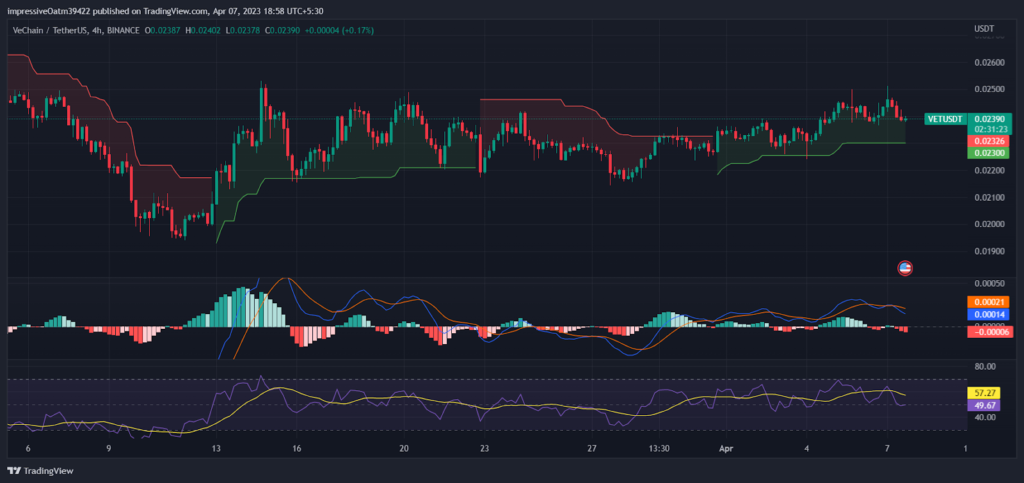
VET price in the smaller time frame suggests a market to be moving up and down at a very high frequency. The Super Trend shows the market to steadily move in uptrend, but still forming a staggered rise. The uptrend line forms a step-like pattern, after taking support from the price level $0.02245. The still transitioning market makes MACD entwined and records both buyer and seller interaction.
Conclusion
VET price forms a rising channel and forms a falling trend in the intraday. The trading volume suggests the market to be stagnant and that it is under a bearish influence. The daily time frame indicators suggest VET prices to move closer to a mixed market where both buyers and sellers are both engaged in trading of VET. For the smaller time frame, the indicators suggest a growing bearish trend in the market as the price trend reversal begins. The holders can rely on the support near $0.02245.
Technical levels
Support levels: $0.02245 and $0.01975
Resistance levels: $0.02485 and $0.02825
Disclaimer
The views and opinions stated by the author, or any people named in this article, are for informational purposes only and do not establish financial, investment, or other advice. Investing in or trading crypto assets comes with a risk of financial loss.

Nancy J. Allen is a crypto enthusiast, with a major in macroeconomics and minor in business statistics. She believes that cryptocurrencies inspire people to be their own banks, and step aside from traditional monetary exchange systems. She is also intrigued by blockchain technology and its functioning. She frequently researches, and posts content on the top altcoins, their theoretical working principles and technical price predictions.


